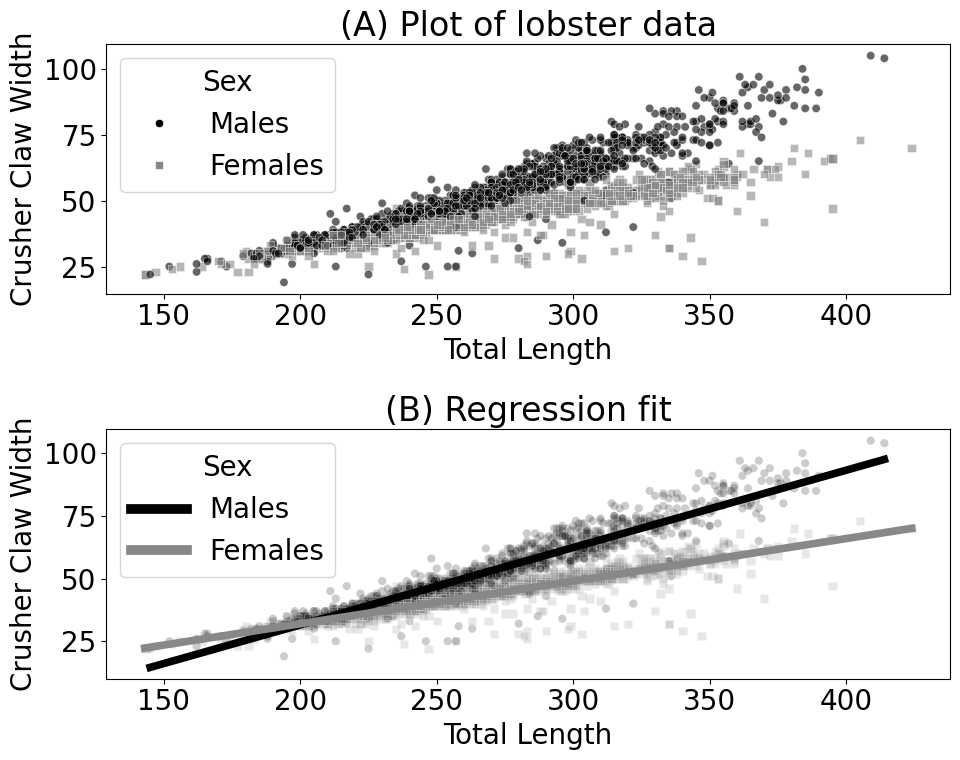
5.2 Why do we embed networks?#
mode = "svg"

import matplotlib

font = {'family' : 'Dejavu Sans',
        'weight' : 'normal',
        'size'   : 20}

matplotlib.rc('font', **font)

import matplotlib
from matplotlib import pyplot as plt
import pandas as pd
import seaborn as sns
lobst_dat = pd.read_csv("Data/lobster.csv")
sex_colors = {"Males": "#000000", "Females": "#888888"}
fig, axs = plt.subplots(2,1, figsize=(10, 8))
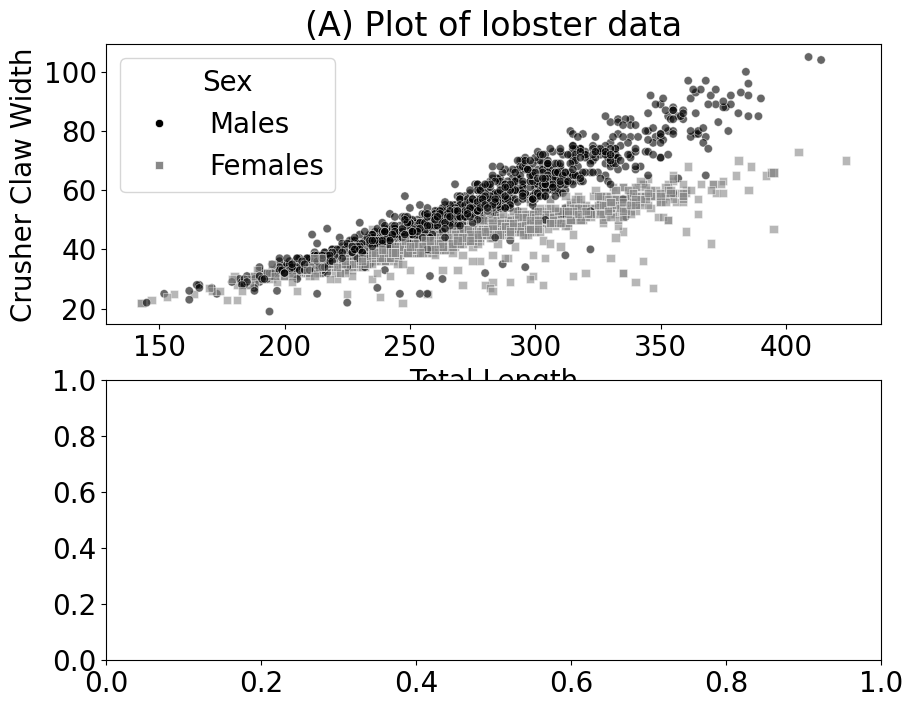
sns.scatterplot(x="TotalLength", y="CrusherClawWidth", hue="Sex", style="Sex", data=lobst_dat,
palette=sex_colors, alpha=0.6, markers={"Males": "o", "Females": "s"}, edgecolor=("white", "black"),
ax=axs[0])
for lh in axs[0].get_legend().legend_handles:
lh.set_alpha(1)
lh._sizes = [100]
axs[0].set_title("(A) Plot of lobster data")
axs[0].set_xlabel("Total Length")
axs[0].set_ylabel("Crusher Claw Width")
Text(0, 0.5, 'Crusher Claw Width')
import statsmodels.api as sm
import statsmodels.formula.api as smf
import os

fit_mod = smf.ols("CrusherClawWidth ~ TotalLength + C(Sex) + TotalLength:C(Sex)", data=lobst_dat).fit()

lobst_dat["Predicted"] = fit_mod.predict(lobst_dat)
# Plot the fitted regression line

sns.scatterplot(x="TotalLength", y="CrusherClawWidth", hue="Sex", style="Sex", data=lobst_dat,
                palette=sex_colors, alpha=0.2, markers={"Males": "o", "Females": "s"}, edgecolor=("white", "black"),
                ax=axs[1], legend=False)


sns.lineplot(x="TotalLength", y="Predicted", hue="Sex", data=lobst_dat,
                palette=sex_colors, ax=axs[1], linewidth=5.5)

# Customize legend marker sizes
for line in axs[1].get_legend().get_lines():
    line.set_linewidth(7)  # Adjust the size as needed for the legend markers

axs[1].set_title("(B) Regression fit")
axs[1].set_xlabel("Total Length")
axs[1].set_ylabel("Crusher Claw Width")
fig.tight_layout()

os.makedirs("Figures", exist_ok=True)
fname = "lobster"
if mode != "png":
    os.makedirs(f"Figures/{mode:s}", exist_ok=True)
    fig.savefig(f"Figures/{mode:s}/{fname:s}.{mode:s}")

os.makedirs("Figures/png", exist_ok=True)
fig.savefig(f"Figures/png/{fname:s}.png")
fig