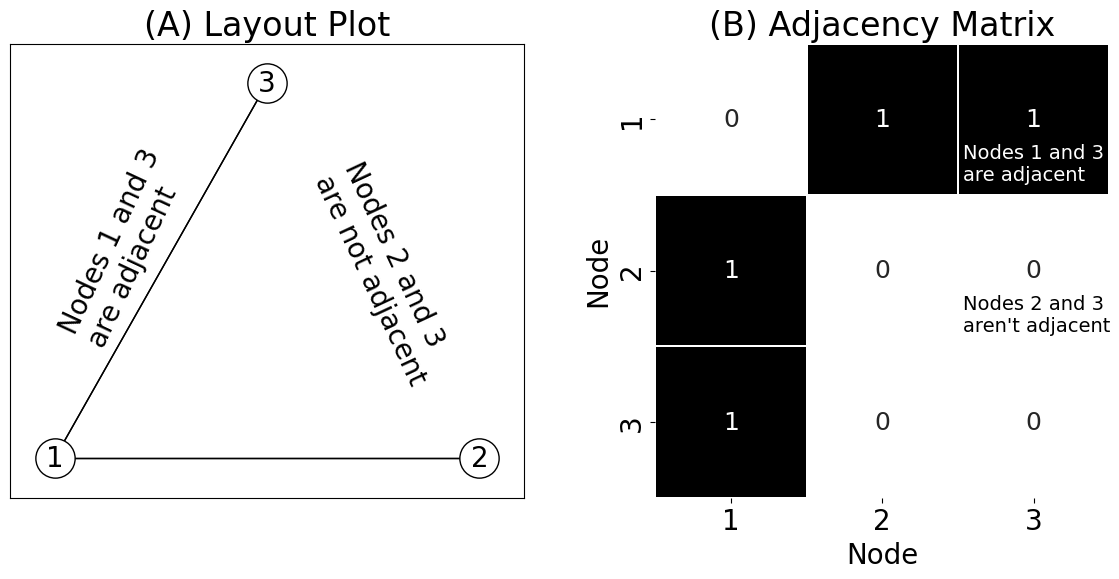
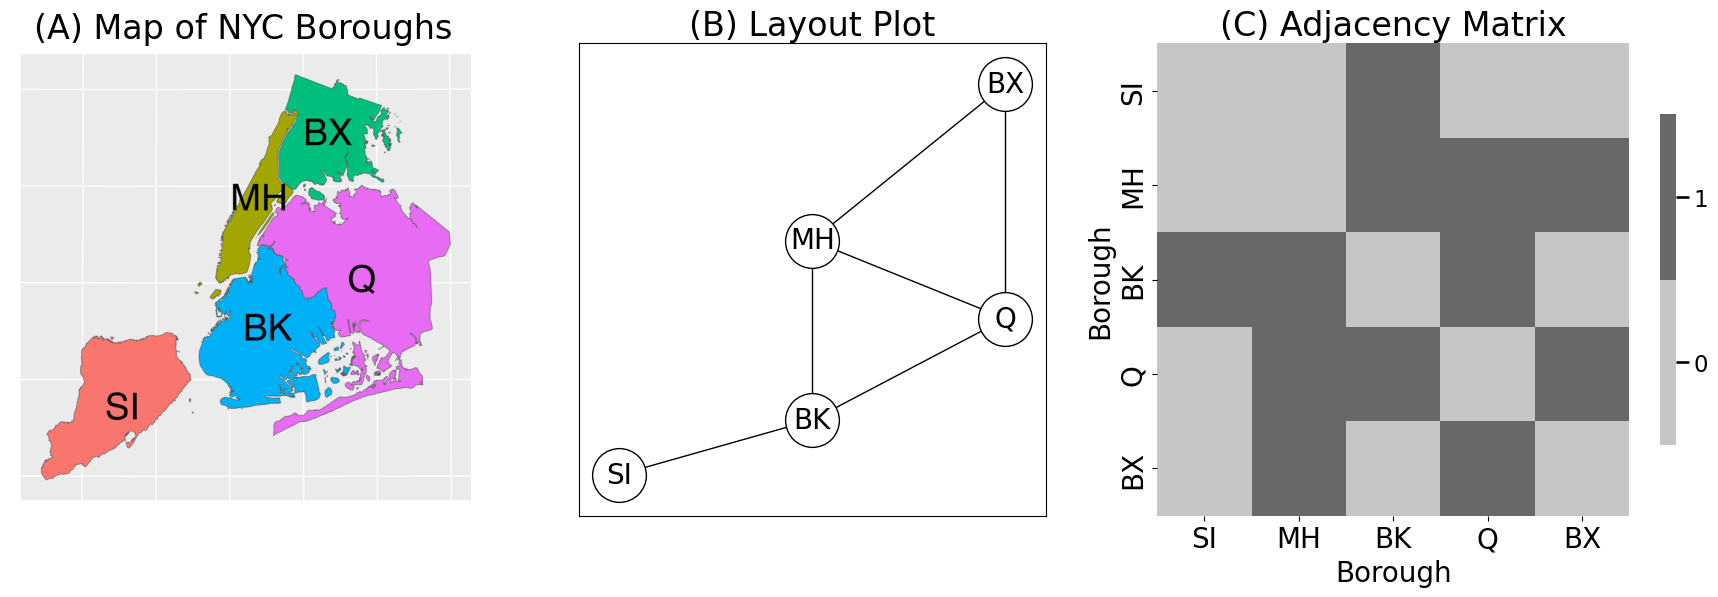
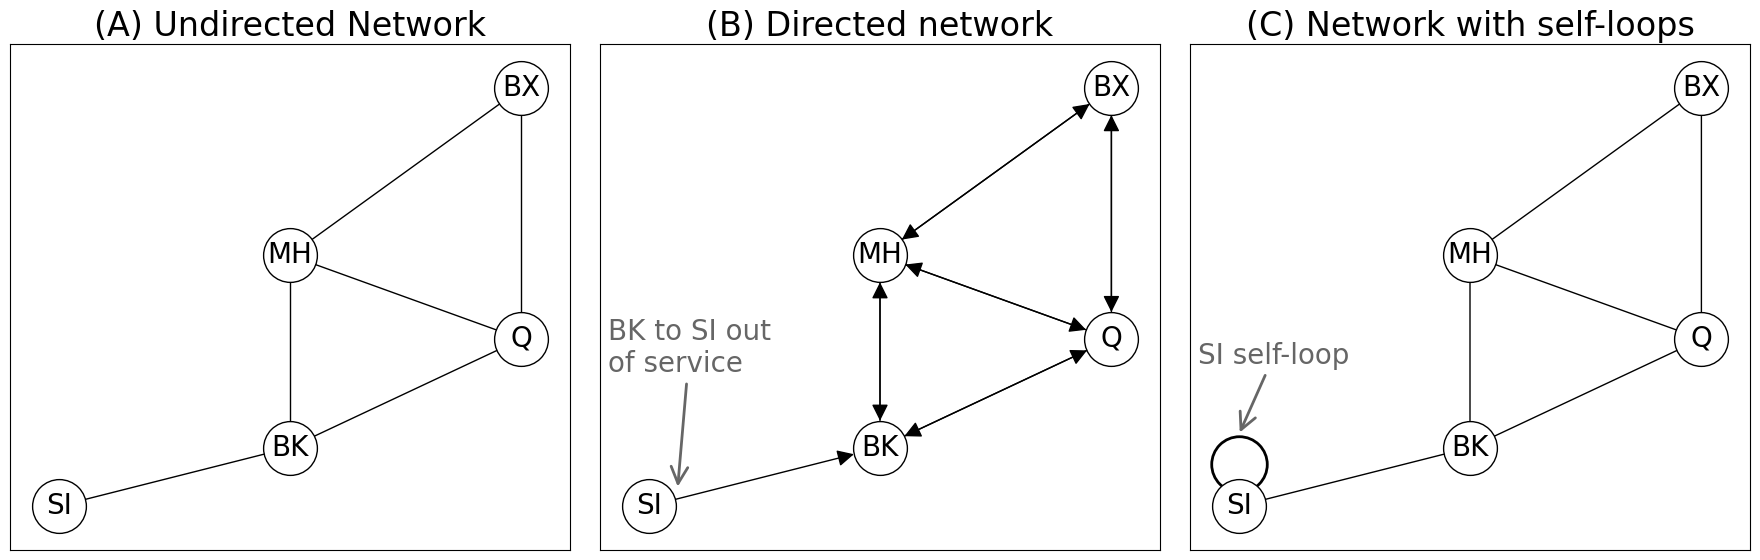
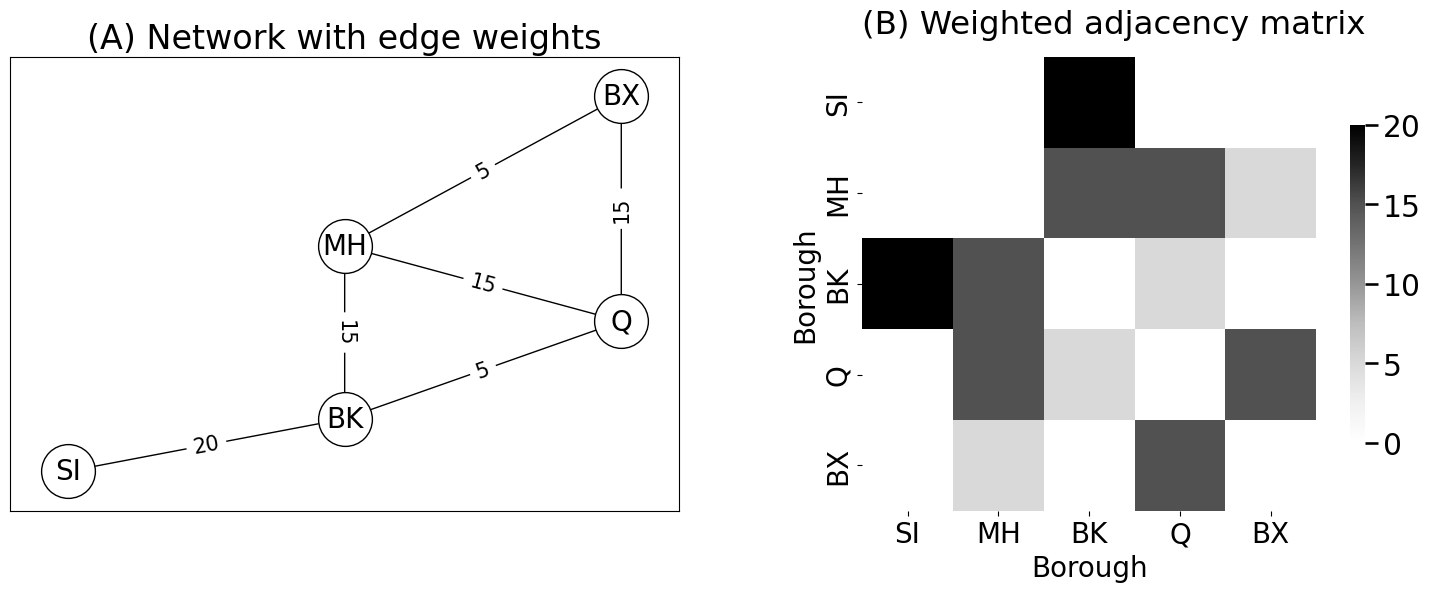
3.1 Properties of Networks#
mode = "svg"

import matplotlib

font = {'family' : 'Dejavu Sans',
        'weight' : 'normal',
        'size'   : 20}

matplotlib.rc('font', **font)

import matplotlib
from matplotlib import pyplot as plt
import numpy as np
import networkx as nx
from graphbook_code import heatmap
import seaborn as sns
import os


G = nx.DiGraph()
# add nodes to the network
G.add_node("1", pos=(1,1))
G.add_node("2", pos=(4,4))
G.add_node("3", pos=(4,2))
# add edges to the network
G.add_edge("1", "2")
G.add_edge("2", "1")
G.add_edge("1", "3")
G.add_edge("3", "1")
# the coordinates in space to use for plotting the nodes
# in the layout plot
pos = {"1": (0, 0), "2": (1, 0), "3": (.5, .5)}

# axs[0]
fig, axs = plt.subplots(1,2, figsize=(12, 6))
nx.draw_networkx(G, with_labels=True, node_color="white", pos=pos,
                 font_size=20, node_size=800, font_color="black", arrows=False,
                 width=1, edgecolors="#000000", ax=axs[0])
axs[0].annotate("Nodes 1 and 3\nare adjacent", (0, .15), rotation=65)
axs[0].annotate("Nodes 2 and 3\nare not adjacent", (.6, .1), rotation=-65)

# axs[1]
A = np.asarray(nx.to_numpy_array(G))
heatmap(A, annot=True, linewidths=.1, cbar=False,
        xticklabels=[1,2,3], xtitle="Node",
        yticklabels=[1,2,3], ytitle="Node", ax=axs[1]
       )
axs[1].annotate("Nodes 1 and 3\nare adjacent", (2.03, .9), color="white", size=14)
axs[1].annotate("Nodes 2 and 3\naren't adjacent", (2.03, 1.9), color="black", size=14)
axs[0].set_title("(A) Layout Plot")
axs[1].set_title("(B) Adjacency Matrix")

fig.tight_layout()

os.makedirs("Figures", exist_ok=True)
fname = "basic_mtxs"
if mode != "png":
    os.makedirs(f"Figures/{mode:s}", exist_ok=True)
    fig.savefig(f"Figures/{mode:s}/{fname:s}.{mode:s}")

os.makedirs("Figures/png", exist_ok=True)
fig.savefig(f"Figures/png/{fname:s}.png")
import networkx as nx
from graphbook_code import heatmap

# create an undirected network G
G = nx.Graph()
# add the nodes like before
G.add_node("SI", pos=(2,1))
G.add_node("MH", pos=(4,4))
G.add_node("BK", pos=(4,1.7))
G.add_node("Q", pos=(6,3))
G.add_node("BX", pos=(6,6))

# specify boroughs that are adjacent to one another
pos = nx.get_node_attributes(G, 'pos')
G.add_edge("SI", "BK")
G.add_edge("MH", "BK")
G.add_edge("BK", "Q")
G.add_edge("MH", "Q")
G.add_edge("MH", "BX")
G.add_edge("Q", "BX")

A = nx.to_numpy_array(G)
import matplotlib.image as mpimg

# plotting
fig, axs = plt.subplots(1, 3, figsize=(18, 6), gridspec_kw={"width_ratios": [1,1, 1.29]})
nx.draw_networkx(G, with_labels=True, node_color="white", pos=pos,
                 font_size=20, node_size=1500, font_color="black", arrows=False,
                 width=1, edgecolors="#000000", ax=axs[1])

# pass in the xticklabels and yticklabels corresponding to the
# appropriately ordered boroughs (in the order we constructed them)
heatmap(A.astype(int), xticklabels=["SI", "MH", "BK", "Q", "BX"],
        yticklabels=["SI", "MH", "BK", "Q", "BX"], ax=axs[2],
        xtitle="Borough", ytitle="Borough"
       )
axs[0].imshow(mpimg.imread('./Images/NYC_boros.png'))
axs[0].axis("off")
axs[1].set_title("(B) Layout Plot")
axs[2].set_title("(C) Adjacency Matrix")
axs[0].set_title("(A) Map of NYC Boroughs")

fig.tight_layout()

fname = "nyc_ex"
if mode != "png":
    fig.savefig(f"Figures/{mode:s}/{fname:s}.{mode:s}")

fig.savefig(f"Figures/png/{fname:s}.png")
from copy import deepcopy

G_dir = G.to_directed()

# remove the edge from BK to SI
G_dir.remove_edge("BK", "SI")
from graspologic.utils import is_symmetric

A = nx.to_numpy_array(G)
is_symmetric(A)
# True
A_dir = nx.to_numpy_array(G_dir)
is_symmetric(A_dir)
# False
False
G_loopy = deepcopy(G)
# add edge from SI to itself
G_loopy.add_edge("SI", "SI")

circle_rad = 20  # This is the radius, in points

# axs[0]
fig, axs = plt.subplots(1, 3, figsize=(18, 6))
nx.draw_networkx(G, with_labels=True, node_color="white", pos=pos,
                 font_size=20, node_size=1500, font_color="black", arrows=False,
                 width=1, edgecolors="#000000", ax=axs[0])
axs[0].set_title("(A) Undirected Network")

# axs[1]
nx.draw_networkx(G_dir, with_labels=True, node_color="white", pos=pos,
                 font_size=20, node_size=1500, font_color="black", arrows=True,
                 width=1, edgecolors="#000000", ax=axs[1], arrowsize=25)
axs[1].annotate("BK to SI out\nof service", xytext=(1.65, 2.6), xy=(2.25, 1.2),
            arrowprops=dict(arrowstyle="->", color="#666666", mutation_scale=30, lw=2), color="#666666")
axs[1].set_title("(B) Directed network")

# axs[2]
axs[2].plot(2, 1.5, 'o',
        ms=circle_rad * 2, mec='black', mfc='none', mew=2)


nx.draw_networkx(G, with_labels=True, node_color="white", pos=pos,
                 font_size=20, node_size=1500, font_color="black", arrows=True,
                 width=1, edgecolors="#000000", ax=axs[2], arrowsize=25)


axs[2].annotate("SI self-loop", xytext=(1.65, 2.7), xy=(2,1.85),
            arrowprops=dict(arrowstyle="->", color="#666666", mutation_scale=30, lw=2), color="#666666")

axs[2].set_title("(C) Network with self-loops")

fig.tight_layout()

fname = "directed"
if mode != "png":
    fig.savefig(f"Figures/{mode:s}/{fname:s}.{mode:s}")

fig.savefig(f"Figures/png/{fname:s}.png")
from graspologic.utils import is_loopless
is_loopless(A)
# True
A_loopy = nx.to_numpy_array(G_loopy)
is_loopless(A_loopy)
# False
False
from graspologic.utils import is_unweighted

G_weight = nx.Graph()

G_weight.add_node("SI", pos=(2,1))
G_weight.add_node("MH", pos=(4,4))
G_weight.add_node("BK", pos=(4,1.7))
G_weight.add_node("Q", pos=(6,3))
G_weight.add_node("BX", pos=(6,6))

# this time, we add weights to the edges
pos = nx.get_node_attributes(G, 'pos')
G_weight.add_edge("SI", "BK", weight=20)
G_weight.add_edge("MH", "BK", weight=15)
G_weight.add_edge("BK", "Q", weight=5)
G_weight.add_edge("MH", "Q", weight=15)
G_weight.add_edge("MH", "BX", weight=5)
G_weight.add_edge("Q", "BX", weight=15)

A_weight = nx.to_numpy_array(G_weight)

is_unweighted(A)
# True
True
is_unweighted(A_weight)
# False
False
A_weight = nx.to_numpy_array(G_weight, nonedge=0).astype(float)


fig, axs = plt.subplots(1, 2, figsize=(15, 6))

edge_wts = nx.get_edge_attributes(G_weight, "weight")
nx.draw_networkx(G_weight, with_labels=True, node_color="white", pos=pos,
                 font_size=20, node_size=1500, font_color="black", arrows=True,
                 width=1, edgecolors="#000000", ax=axs[0], arrowsize=25)
nx.draw_networkx_edge_labels(G_weight, pos, edge_wts, font_size=15, ax=axs[0])
axs[0].set_title("(A) Network with edge weights")

heatmap(A_weight, xticklabels=["SI", "MH", "BK", "Q", "BX"],
        yticklabels=["SI", "MH", "BK", "Q", "BX"], title="(B) Weighted adjacency matrix",
        font_scale=1.3, xtitle="Borough", ytitle="Borough", ax=axs[1])
fig.tight_layout()

fname = "weighted"
if mode != "png":
    fig.savefig(f"Figures/{mode:s}/{fname:s}.{mode:s}")

fig.savefig(f"Figures/png/{fname:s}.png")
from graspologic.utils import is_unweighted

A_weight = nx.to_numpy_array(G_weight)
is_unweighted(A)
# True
True
is_unweighted(A_weight)
# False
False