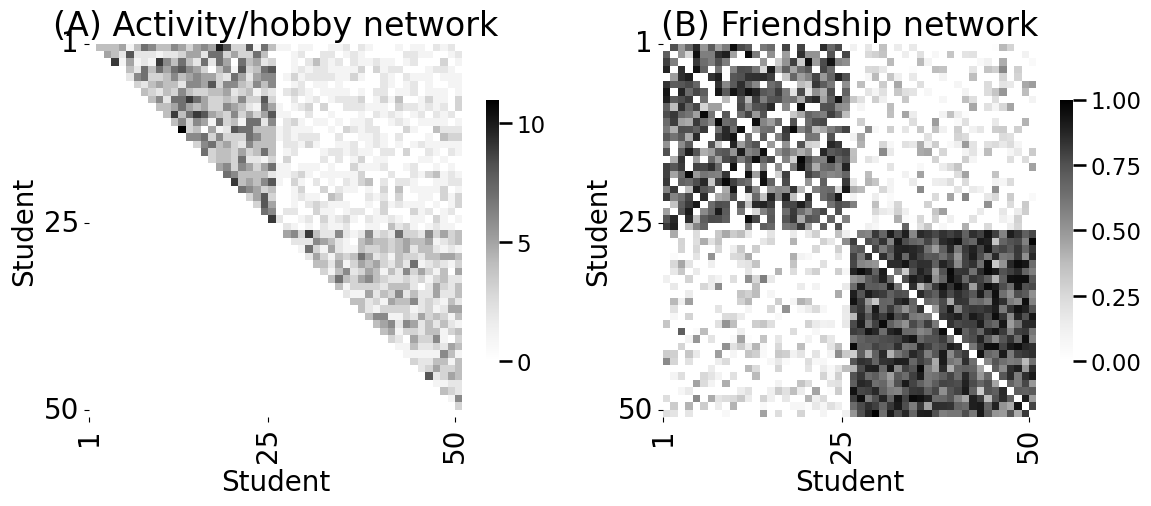
3.7 Edge Regularization#
mode = "svg"

import matplotlib

font = {'family' : 'Dejavu Sans',
        'weight' : 'normal',
        'size'   : 20}

matplotlib.rc('font', **font)

import matplotlib
from matplotlib import pyplot as plt
from graspologic.simulations import sbm
import numpy as np
from graphbook_code import heatmap
import os

wtargsa = [[dict(n=50, p=.09), dict(n=50, p=.02)],
          [dict(n=50, p=.02), dict(n=50, p=.06)]]
# activity network as upper triangle matrix
A_activity_uppertri = sbm(n=[25, 25], p=[[1,1], [1,1]], wt=np.random.binomial, wtargs=wtargsa, loops=False, directed=False)
A_activity_uppertri = np.triu(A_activity_uppertri)

# friend network
wtargsf = [[dict(a=4, b=2), dict(a=2, b=6)],
          [dict(a=2, b=6), dict(a=6, b=2)]]
A_friend = sbm(n=[25, 25], p=[[.8, .4], [.4, 1]], wt=np.random.beta, wtargs=wtargsf, directed=True)

fig, axs = plt.subplots(1,2,figsize=(12, 5))
heatmap(A_activity_uppertri, xticks=[0, 24, 49], yticks=[0, 24, 49],
        xtitle="Student", ytitle="Student", xticklabels=[1,25,50],
        yticklabels=[1,25,50], ax=axs[0])
axs[0].set_title("(A) Activity/hobby network")
heatmap(A_friend, xticks=[0, 24, 49], yticks=[0, 24, 49],
        xtitle="Student", ytitle="Student", xticklabels=[1,25,50],
        yticklabels=[1,25,50], vmin=0, vmax=1, ax=axs[1])
axs[1].set_title("(B) Friendship network")
fig.tight_layout()

os.makedirs("Figures", exist_ok=True)
fname = "friendex"
if mode != "png":
    os.makedirs(f"Figures/{mode:s}", exist_ok=True)
    fig.savefig(f"Figures/{mode:s}/{fname:s}.{mode:s}")

os.makedirs("Figures/png", exist_ok=True)
fig.savefig(f"Figures/png/{fname:s}.png")
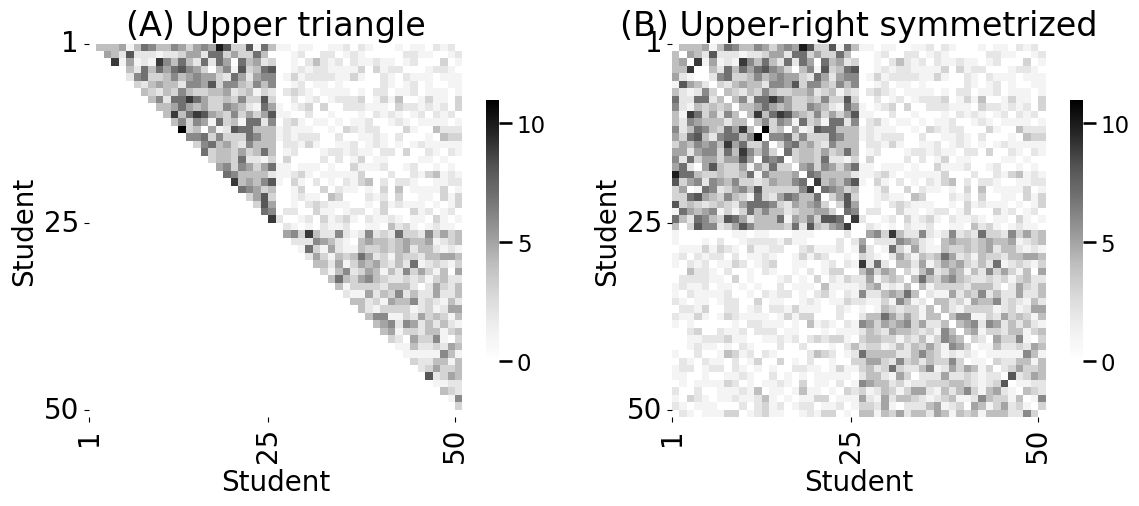
from graspologic.utils import symmetrize

# upper-triangle symmetrize the upper triangle
A_activity = symmetrize(A_activity_uppertri, method="triu")
fig, axs = plt.subplots(1,2,figsize=(12, 5))
heatmap(A_activity_uppertri, xticks=[0, 24, 49], yticks=[0, 24, 49],
        xtitle="Student", ytitle="Student", xticklabels=[1,25,50],
        yticklabels=[1,25,50], ax=axs[0])
axs[0].set_title("(A) Upper triangle")
heatmap(A_activity, xticks=[0, 24, 49], yticks=[0, 24, 49],
        xtitle="Student", ytitle="Student", xticklabels=[1,25,50],
        yticklabels=[1,25,50], ax=axs[1])
axs[1].set_title("(B) Upper-right symmetrized")

fig.tight_layout()

fname = "triusym"
if mode != "png":
    fig.savefig(f"Figures/{mode:s}/{fname:s}.{mode:s}")

fig.savefig(f"Figures/png/{fname:s}.png")
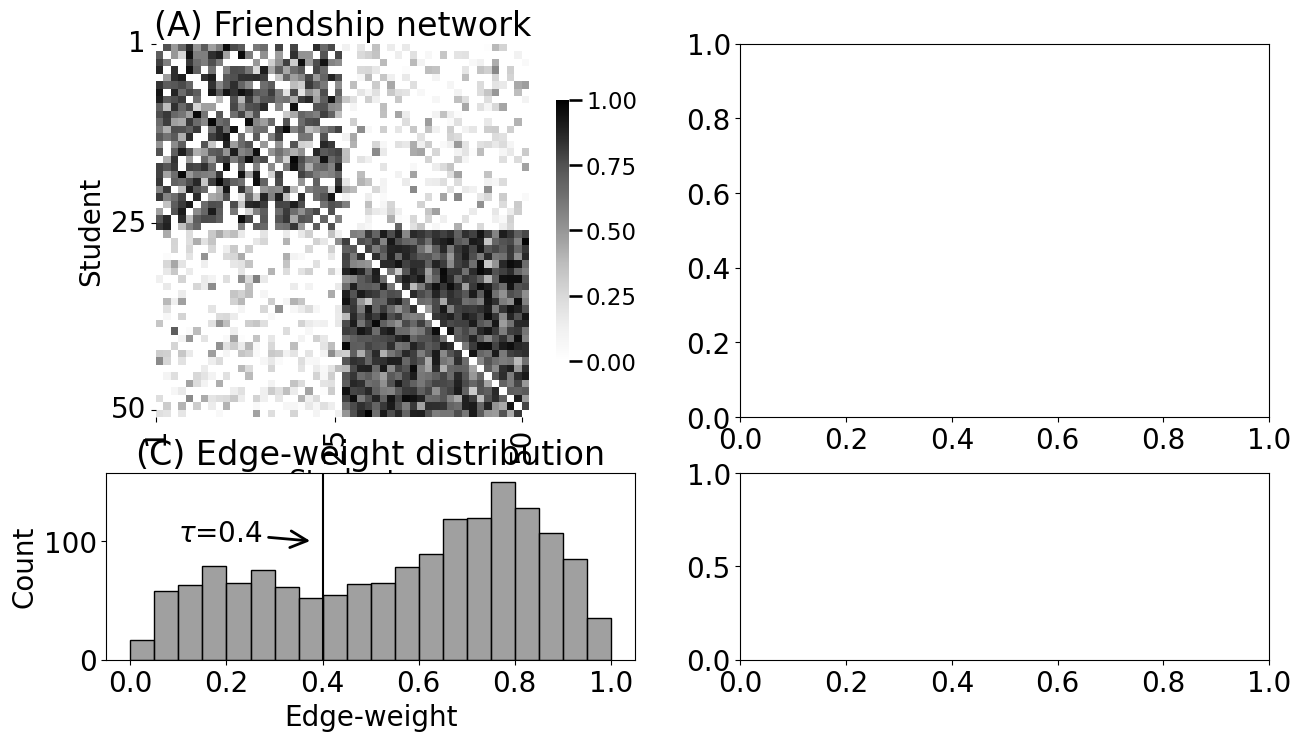
# symmetrize with averaging
A_friend_avg_sym = symmetrize(A_friend, method="avg")
from graspologic.utils import augment_diagonal

A_friend_aug = augment_diagonal(A_friend)
from seaborn import histplot

def discard_diagonal(A):
    """
    A function that discards the diagonal of a matrix,
    and returns its non-diagonal edge-weights.
    """
    # create a mask that is True for the non-diagonal edges
    non_diag_idx = np.where(~np.eye(A.shape[0], dtype=bool))
    return A[non_diag_idx].flatten()

# get the non-diagonal edge-weights
friend_nondiag_ew = discard_diagonal(A_friend)
# get the non-zero, non-diagonal edge weights
friend_nondiag_nz_ew = friend_nondiag_ew[friend_nondiag_ew > 0]

fig, axs = plt.subplots(2,2, figsize=(15, 8), gridspec_kw={"height_ratios": [1, .5]})
# plot the histogram, as above

heatmap(A_friend, xticks=[0, 24, 49], yticks=[0, 24, 49],
        xtitle="Student", ytitle="Student", xticklabels=[1,25,50],
        yticklabels=[1,25,50], vmin=0, vmax=1, ax=axs[0][0])
axs[0][0].set_title("(A) Friendship network")

histplot(friend_nondiag_nz_ew, bins=20, binrange=(0, 1), ax=axs[1][0], color="gray")
axs[1][0].set_xlabel("Edge-weight")
axs[1][0].set_title("(C) Edge-weight distribution")
axs[1][0].axvline(x=0.4, color="black")
axs[1][0].annotate("$\\tau$=0.4", (0.38, 100), (0.1, 100),
            arrowprops=dict(arrowstyle="->", color="#000000", mutation_scale=30, lw=2),
)
Text(0.1, 100, '$\\tau$=0.4')
def truncate_network(A, threshold):
    A_cp = np.copy(A)
    A_cp[A_cp <= threshold] = 0
    return A_cp

tau = 0.4
A_friend_trunc = truncate_network(A_friend, threshold=tau)

friend_trunc_nondiag_ew = discard_diagonal(A_friend_trunc)
# get the non-zero, non-diagonal edge weights
friend_trunc_nondiag_nz_ew = friend_trunc_nondiag_ew[friend_trunc_nondiag_ew > 0]

heatmap(A_friend_trunc, xticks=[0, 24, 49], yticks=[0, 24, 49],
        xtitle="Student", ytitle="Student", xticklabels=[1,25,50],
        yticklabels=[1,25,50], vmin=0, vmax=1, ax=axs[0][1])
axs[0][1].set_title("(C) Friendship network (truncated)")

histplot(friend_trunc_nondiag_nz_ew, bins=20, binrange=(0, 1), ax=axs[1][1], color="gray")
axs[1][1].set_xlabel("Edge-weight")
axs[1][1].set_title("(C) Edge-weight distribution (truncated)")
axs[1][1].axvline(x=0.4, color="black")
axs[1][1].annotate("$\\tau$=0.4", (0.38, 100), (0.1, 100),
            arrowprops=dict(arrowstyle="->", color="#000000", mutation_scale=30, lw=2),
)
fig.tight_layout()

fname = "truncate"
if mode != "png":
    fig.savefig(f"Figures/{mode:s}/{fname:s}.{mode:s}")

fig.savefig(f"Figures/png/{fname:s}.png")
fig
# find the indices which are in the upper triangle and not in the diagonal
upper_tri_non_diag_idx = np.where(np.triu(np.ones(A_activity.shape), k=1).astype(bool))
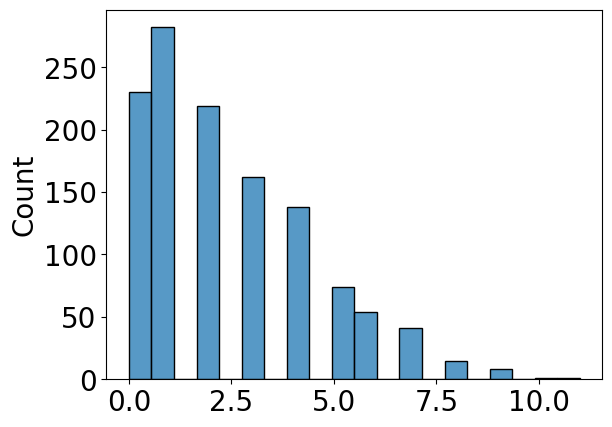
q = 0.5 # desired percentile is 50, or a fraction of 0.5
histplot(A_activity[upper_tri_non_diag_idx].flatten())
# use the quantile function with the desired fraction q
tau = np.quantile(A_activity[upper_tri_non_diag_idx], q=q)
n_lteq_tau = np.sum(A_activity[upper_tri_non_diag_idx] <= tau)
n_gt_tau = np.sum(A_activity[upper_tri_non_diag_idx] > tau)
print("Number of edges less than or equal to tau: {}".format(n_lteq_tau))
print("Number of edges greater than to tau: {}".format(n_gt_tau))
fig.tight_layout()
Number of edges less than or equal to tau: 731
Number of edges greater than to tau: 494
from numpy import copy
def min_difference(arr):
b = np.diff(np.sort(arr))
return b[b>0].min()
def quantile_threshold_network(A, directed=False, loops=False, q=0.5):
# a function to threshold a network on the basis of the
# fraction q
A_cp = np.copy(A)
n = A.shape[0]
E = np.random.uniform(low=0, high=min_difference(A)/10, size=(n, n))
if not directed:
# make E symmetric
E = (E + E.transpose())/2
mask = np.ones((n, n))
if not loops:
# remove diagonal from E
E = E - np.diag(np.diag(E))
# exclude diagonal from the mask
mask = mask - np.diag(np.diag(mask))
Ap = A_cp + E
tau = np.quantile(Ap[np.where(mask)].flatten(), q=q)
A_cp[Ap <= tau] = 0; A_cp[Ap > tau] = 1
return A_cp
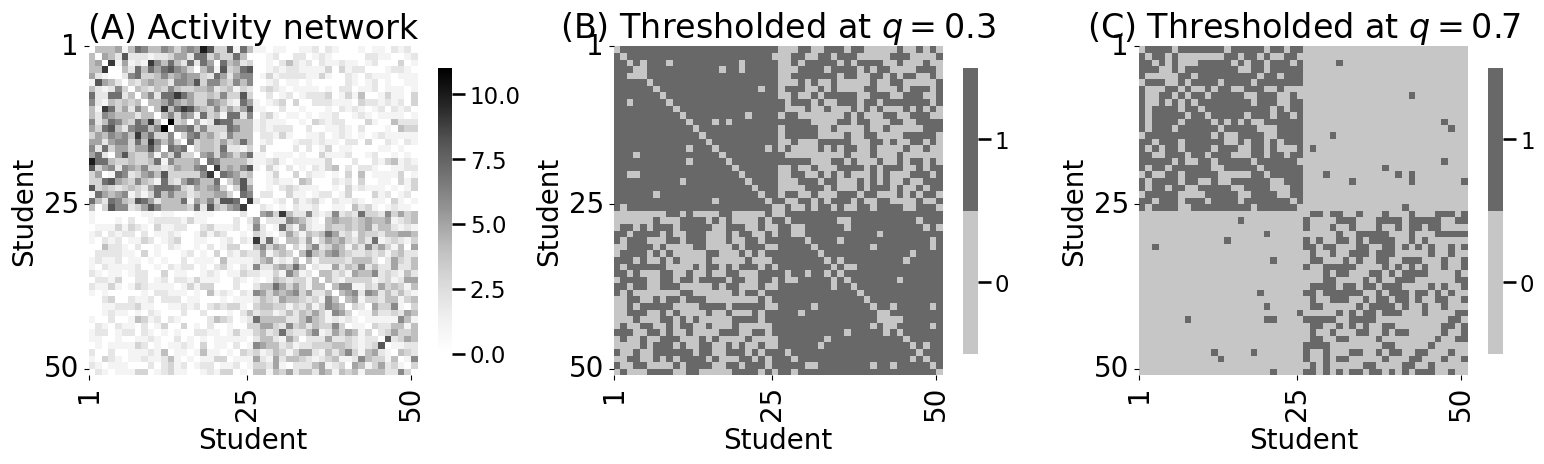
A_activity_thresholded03 = quantile_threshold_network(A_activity, q=0.3)
A_activity_thresholded07 = quantile_threshold_network(A_activity, q=0.7)
fig, axs = plt.subplots(1,3,figsize=(16, 5))
heatmap(A_activity, xticks=[0, 24, 49], yticks=[0, 24, 49],
xtitle="Student", ytitle="Student", xticklabels=[1,25,50],
yticklabels=[1,25,50], ax=axs[0])
axs[0].set_title("(A) Activity network")
heatmap(A_activity_thresholded03.astype(int), xticks=[0, 24, 49], yticks=[0, 24, 49],
xtitle="Student", ytitle="Student", xticklabels=[1,25,50],
yticklabels=[1,25,50], ax=axs[1])
axs[1].set_title("(B) Thresholded at $q=0.3$")
heatmap(A_activity_thresholded07.astype(int), xticks=[0, 24, 49], yticks=[0, 24, 49],
xtitle="Student", ytitle="Student", xticklabels=[1,25,50],
yticklabels=[1,25,50], ax=axs[2])
axs[2].set_title("(C) Thresholded at $q=0.7$")
fig.tight_layout()
fname = "threshold_res"
if mode != "png":
fig.savefig(f"Figures/{mode:s}/{fname:s}.{mode:s}")
fig.savefig(f"Figures/png/{fname:s}.png")
from graspologic.utils import is_unweighted, is_loopless, is_symmetric

def simple_network_dens(X):
    # make sure the network is simple
    if (not is_unweighted(X)) or (not is_loopless(X)) or (not is_symmetric(X)):
        raise TypeError("Network is not simple!")
    # count the non-zero entries in the upper-right triangle
    # for a simple network X
    nnz = np.triu(X, k=1).sum()
    # number of nodes
    n = X.shape[0]
    # number of possible edges is 1/2*n*(n-1)
    poss_edges = 0.5*n*(n-1)
    return nnz/poss_edges

print("Network Density: {:.3f}".format(simple_network_dens(A_activity_thresholded03)))
# Network Density: 0.700
Network Density: 0.700