3.2 Node Properties and Relationships#
mode = "svg"

import matplotlib

font = {'family' : 'Dejavu Sans',
        'weight' : 'normal',
        'size'   : 20}

matplotlib.rc('font', **font)

import matplotlib
from matplotlib import pyplot as plt
import networkx as nx

# create an undirected network G
G = nx.Graph()
# add the nodes like before
G.add_node("SI", pos=(2,1))
G.add_node("MH", pos=(4,4))
G.add_node("BK", pos=(4,1.7))
G.add_node("Q", pos=(6,3))
G.add_node("BX", pos=(6,6))

# specify boroughs that are connected to one another
pos = nx.get_node_attributes(G, 'pos')
G.add_edge("SI", "BK")
G.add_edge("MH", "BK")
G.add_edge("BK", "Q")
G.add_edge("MH", "Q")
G.add_edge("MH", "BX")
G.add_edge("Q", "BX")

A = nx.to_numpy_array(G)
def in_degrees(A):
"""
A function to compute the in-degrees for the nodes of an adjacency matrix.
"""
return A.sum(axis=1)
def out_degrees(A):
"""
A function to compute the out-degrees for the nodes of an adjacency matrix.
"""
return A.sum(axis=0)
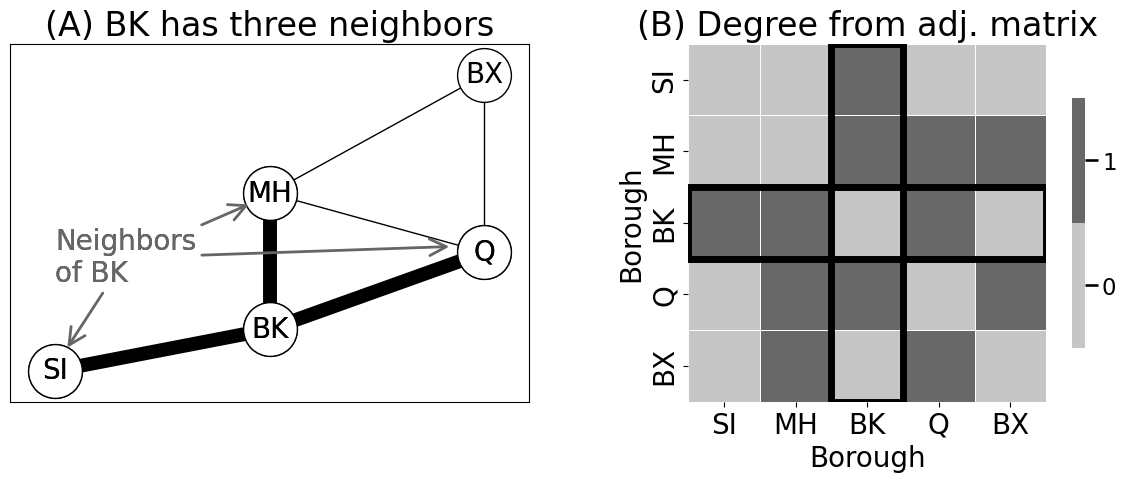
# get the degree for node BK, which is node 2 in our network,
# using either the in- or out-degree
print(in_degrees(A)[2])
# 3.0
3.0
from graphbook_code import heatmap
from matplotlib import patches
import os

fig, axs = plt.subplots(1, 2, figsize=(12, 5))
nx.draw_networkx(G, with_labels=True, node_color="white", pos=pos,
                 font_size=20, node_size=1500, font_color="black", arrows=False,
                 width=1, edgecolors="#000000", ax=axs[0])
axs[0].annotate("Neighbors\nof BK", (2.1, 1.35), (2, 2.5),
            arrowprops=dict(arrowstyle="->", color="#666666", mutation_scale=30, lw=2), color="#666666")
axs[0].annotate("Neighbors\nof BK", (3.83, 3.83), (2, 2.5),
            arrowprops=dict(arrowstyle="->", color="#666666", mutation_scale=30, lw=2), color="#666666")
axs[0].annotate("Neighbors\nof BK", (5.7, 3.1), (2, 2.5),
            arrowprops=dict(arrowstyle="->", color="#666666", mutation_scale=30, lw=2), color="#666666")

# make a new graph to highlight the edges from BK
G_highlight = nx.Graph()
G_highlight.add_node("BK", pos=(4, 1.7))
G_highlight.add_node("MH", pos=(4, 4))
G_highlight.add_node("SI", pos=(2, 1))
G.add_node("Q", pos=(6,3))

G_highlight.add_edge("BK", "SI")
G_highlight.add_edge("BK", "MH")
G_highlight.add_edge("BK", "Q")
nx.draw_networkx(G_highlight, with_labels=True, node_color="white", pos=pos,
                 font_size=20, node_size=1500, font_color="black", arrows=False,
                 width=10, edgecolors="#000000", ax=axs[0])

# pass in the xticklabels and yticklabels corresponding to the
# appropriately ordered boroughs (in the order we constructed them)
heatmap(A.astype(int), xticklabels=["SI", "MH", "BK", "Q", "BX"],
        yticklabels=["SI", "MH", "BK", "Q", "BX"], ax=axs[1],
        xtitle="Borough", ytitle="Borough",
        linewidths=0.5, linestyle=':'
       )
axs[1].add_patch(
    patches.Rectangle((0, 2), 5, 1, facecolor="none", edgecolor="black", linewidth=5)
)
axs[1].add_patch(
    patches.Rectangle((2, 0), 1, 5, facecolor="none", edgecolor="black", linewidth=5)
)
axs[0].set_title("(A) BK has three neighbors")
axs[1].set_title("(B) Degree from adj. matrix")
fig.tight_layout()

fname = "degree"
if mode != "png":
    os.makedirs(f"Figures/{mode:s}", exist_ok=True)
    fig.savefig(f"Figures/{mode:s}/{fname:s}.{mode:s}")

os.makedirs("Figures/png", exist_ok=True)
fig.savefig(f"Figures/png/{fname:s}.png")
fig, axs = plt.subplots(1, 3, figsize=(16, 5))
nx.draw_networkx(G, with_labels=True, node_color="white", pos=pos,
font_size=20, node_size=1500, font_color="black", arrows=False,
width=1, edgecolors="#000000", ax=axs[0])
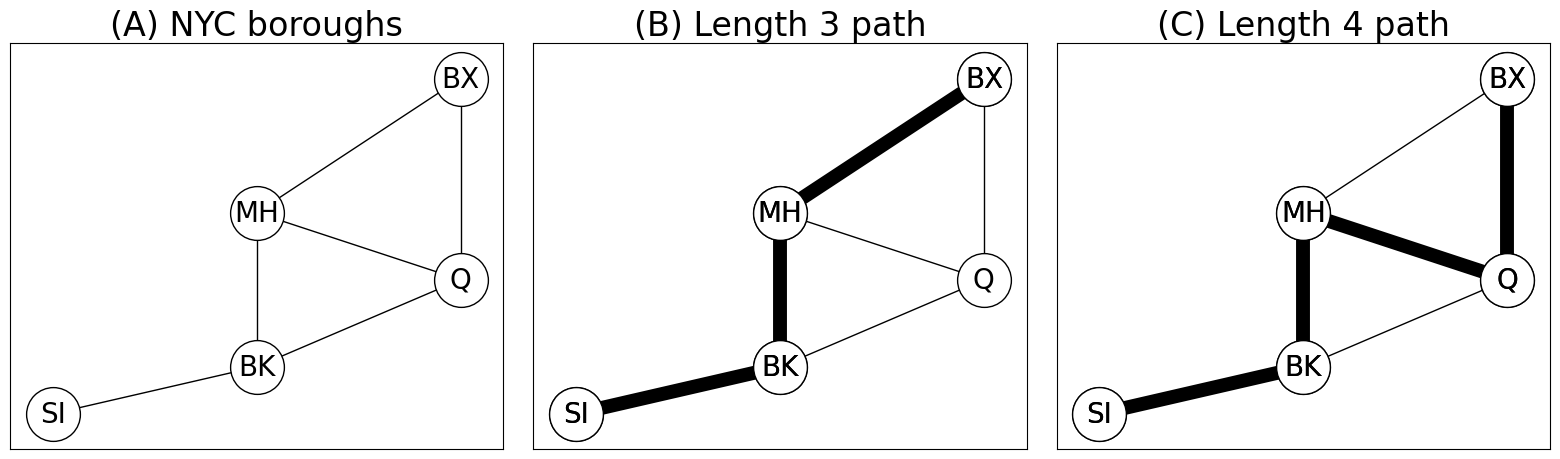
axs[0].set_title("(A) NYC boroughs")
G_3path = nx.Graph()
G_3path.add_node("BK", pos=(4, 1.7))
G_3path.add_node("MH", pos=(4, 4))
G_3path.add_node("SI", pos=(2, 1))
G_3path.add_node("BX", pos=(6,6))
G_3path.add_edge("SI", "BK")
G_3path.add_edge("BK", "MH")
G_3path.add_edge("MH", "BX")
nx.draw_networkx(G, with_labels=True, node_color="white", pos=pos,
font_size=20, node_size=1500, font_color="black", arrows=False,
width=1, edgecolors="#000000", ax=axs[1])
nx.draw_networkx(G_3path, with_labels=True, node_color="white", pos=pos,
font_size=20, node_size=1500, font_color="black", arrows=False,
width=10, edgecolors="#000000", ax=axs[1])
axs[1].set_title("(B) Length 3 path")
G_4path = nx.Graph()
G_4path.add_node("BK", pos=(4, 1.7))
G_4path.add_node("MH", pos=(4, 4))
G_4path.add_node("SI", pos=(2, 1))
G_4path.add_node("BX", pos=(6,6))
G_4path.add_node("Q", pos=(6,3))
G_4path.add_edge("SI", "BK")
G_4path.add_edge("BK", "MH")
G_4path.add_edge("MH", "Q")
G_4path.add_edge("Q", "BX")
nx.draw_networkx(G, with_labels=True, node_color="white", pos=pos,
font_size=20, node_size=1500, font_color="black", arrows=False,
width=1, edgecolors="#000000", ax=axs[2])
nx.draw_networkx(G_4path, with_labels=True, node_color="white", pos=pos,
font_size=20, node_size=1500, font_color="black", arrows=False,
width=10, edgecolors="#000000", ax=axs[2])
axs[2].set_title("(C) Length 4 path")
fig.tight_layout()
fname = "path"
if mode != "png":
fig.savefig(f"Figures/{mode:s}/{fname:s}.{mode:s}")
fig.savefig(f"Figures/png/{fname:s}.png")
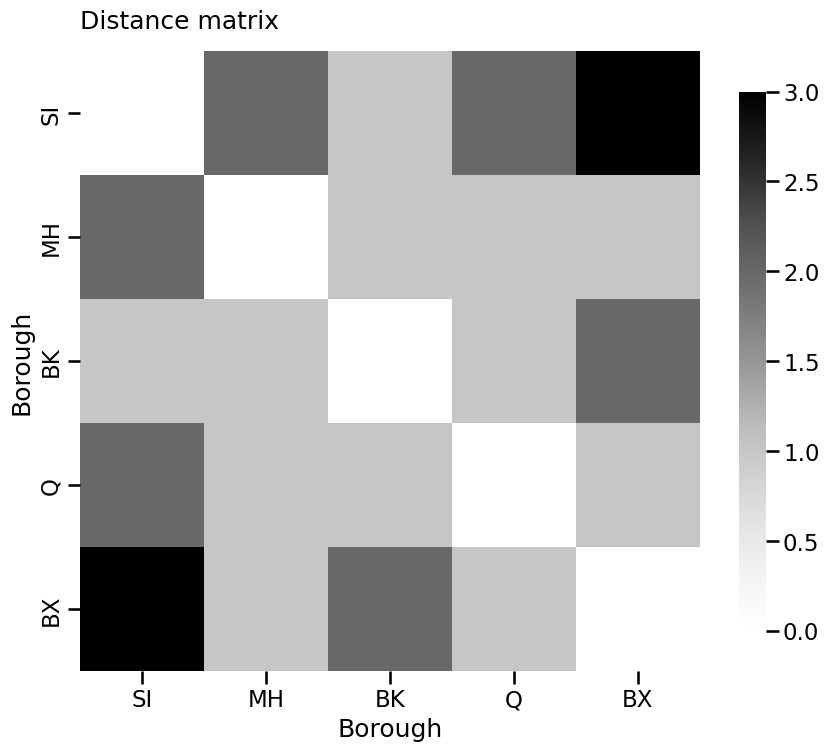
D = nx.floyd_warshall_numpy(G)
heatmap(D, title="Distance matrix",  xticklabels=["SI", "MH", "BK", "Q", "BX"],
        yticklabels=["SI", "MH", "BK", "Q", "BX"], xtitle="Borough", ytitle="Borough")
<Axes: title={'left': 'Distance matrix'}, xlabel='Borough', ylabel='Borough'>