4.7 Degree-Corrected Stochastic Block Models#
mode = "svg"

import matplotlib

font = {'family' : 'Dejavu Sans',
        'weight' : 'normal',
        'size'   : 20}

matplotlib.rc('font', **font)

import matplotlib
from matplotlib import pyplot as plt
import numpy as np
from graspologic.simulations import sample_edges
from graphbook_code import heatmap, plot_vector, \
    generate_sbm_pmtx

def dcsbm(z, theta, B, directed=False, loops=False, return_prob=False):
    """
    A function to sample a DCSBM.
    """
    # uncorrected probability matrix
    Pp = generate_sbm_pmtx(z, B)
    theta = theta.reshape(-1)
    # apply the degree correction
    Theta = np.diag(theta)
    P = Theta @ Pp @ Theta.transpose()
    network = sample_edges(P, directed=directed, loops=loops)
    if return_prob:
        network = (network, P)
    return network
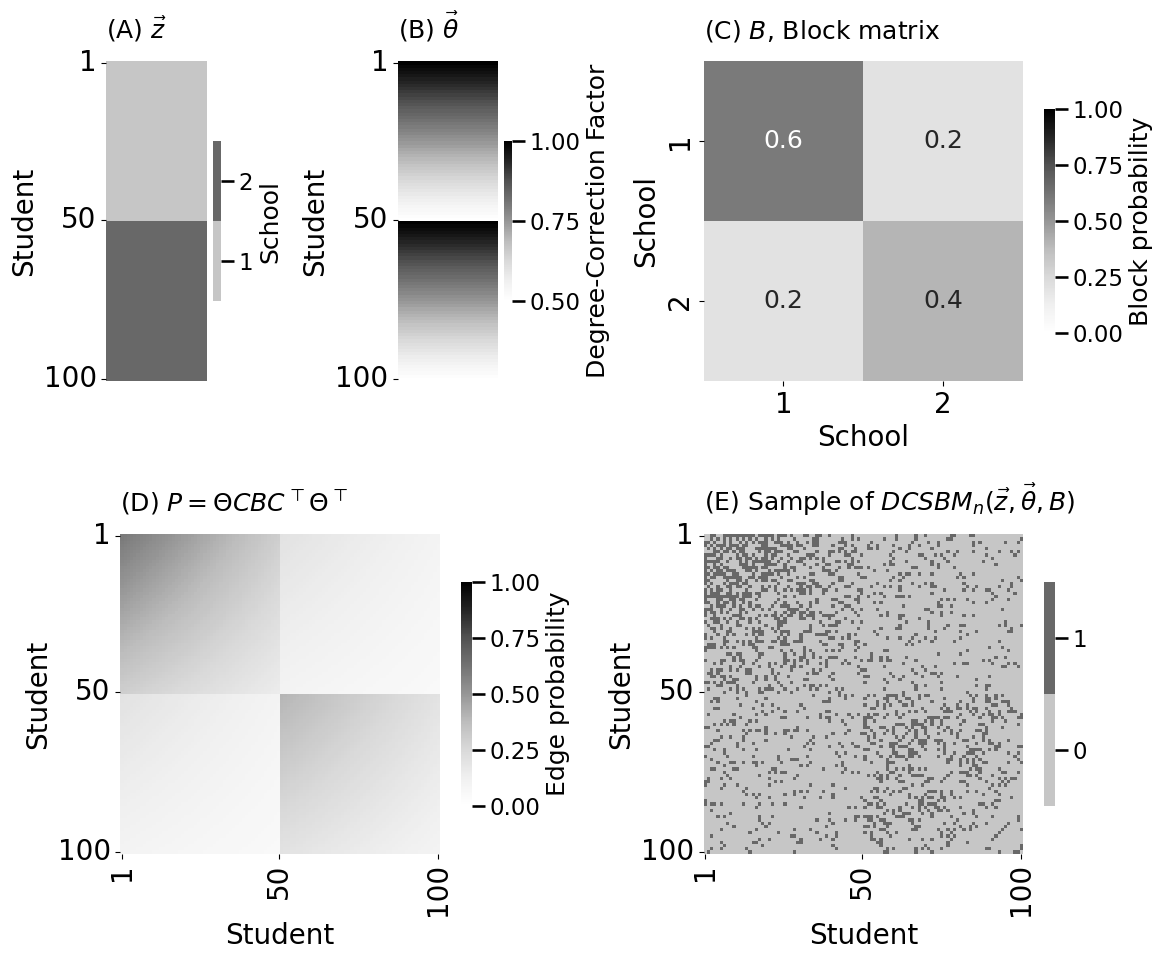
# Observe a network from a DCSBM
nk = 50  # students per school
z = np.repeat([1, 2], nk)
B = np.array([[0.6, 0.2], [0.2, 0.4]])  # same probabilities as from SBM section
theta = np.tile(np.linspace(1, 0.5, nk), 2)
A, P = dcsbm(z, theta, B, return_prob=True)
import matplotlib.gridspec as gridspec
import os

fig = plt.figure(figsize=(12, 10))
gs=  fig.add_gridspec(2, 4)

# Visualize
plot_vector(z.astype(int), title="(A) $\\vec z$", legend_title="School",
            ticks=[0.5, 49.5, 99.5], ticklabels=[1, 50, 100],
            ticktitle="Student", ax=plt.subplot(gs[0,0]))
plot_vector(theta, title="(B) $\\vec \\theta$",
            legend_title="Degree-Correction Factor",
            ticks=[0.5, 49.5, 99.5], ticklabels=[1, 50, 100],
            ticktitle="Student", ax=plt.subplot(gs[0,1]))
heatmap(B, ax=plt.subplot(gs[0, 2:4]), vmin=0, vmax=1,
        xticks=[0.5, 1.5], xticklabels=[1,2], yticks=[0.5, 1.5], yticklabels=[1,2],
        xtitle="School", ytitle="School", title="(C) $B$, Block matrix",
        legend_title="Block probability", annot=True)
heatmap(P, title="(D) $P = \\Theta C B C^\\top \\Theta^\\top$", ax=plt.subplot(gs[1, 0:2]),
        xticks=[0.5, 49.5, 99.5], xticklabels=[1, 50, 100], xtitle="Student",
        yticks=[0.5, 49.5, 99.5], yticklabels=[1, 50, 100], ytitle="Student", vmin=0, vmax=1,
        legend_title="Edge probability")
heatmap(A.astype(int), title="(E) Sample of $DCSBM_n(\\vec z, \\vec \\theta, B)$",
        xticks=[0.5, 49.5, 99.5], xticklabels=[1, 50, 100], xtitle="Student",
        yticks=[0.5, 49.5, 99.5], yticklabels=[1, 50, 100], ytitle="Student",
        ax=plt.subplot(gs[1, 2:4]))
fig.tight_layout()

os.makedirs("Figures", exist_ok=True)
fname = "dcsbm"
if mode != "png":
    os.makedirs(f"Figures/{mode:s}", exist_ok=True)
    fig.savefig(f"Figures/{mode:s}/{fname:s}.{mode:s}")

os.makedirs("Figures/png", exist_ok=True)
fig.savefig(f"Figures/png/{fname:s}.png")
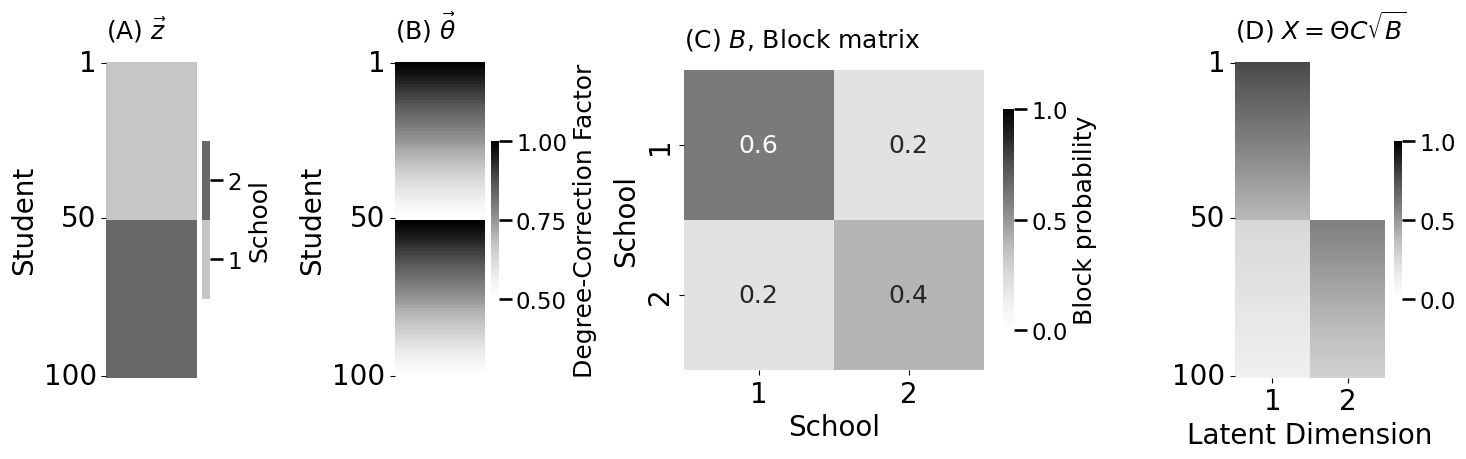
from graphbook_code import lpm_from_sbm

def lpm_from_dcsbm(z, theta, B):
    """
    A function to produce a latent position matrix from a
    community assignment vector, a degree-correction vector,
    and a block matrix.
    """
    # X' = C*sqrt(B)
    Xp = lpm_from_sbm(z, B)
    # X = Theta*X' = Theta * C * sqrt(B)
    return np.diag(theta) @ Xp

X_dcsbm = lpm_from_dcsbm(z, theta, B)
from graphbook_code import lpm_heatmap

fig, axs = plt.subplots(1, 4, figsize=(15, 5), gridspec_kw={"width_ratios": [.3, .3, 1, .5]})

plot_vector(z.astype(int), title="(A) $\\vec z$", legend_title="School",
            ticks=[0.5, 49.5, 99.5], ticklabels=[1, 50, 100],
            ticktitle="Student", ax=axs[0])
plot_vector(theta, title="(B) $\\vec \\theta$",
            legend_title="Degree-Correction Factor",
            ticks=[0.5, 49.5, 99.5], ticklabels=[1, 50, 100],
            ticktitle="Student", ax=axs[1])
heatmap(B, ax=axs[2], vmin=0, vmax=1,
        xticks=[0.5, 1.5], xticklabels=[1,2], yticks=[0.5, 1.5], yticklabels=[1,2],
        xtitle="School", ytitle="School", title="(C) $B$, Block matrix",
        legend_title="Block probability", annot=True)
lpm_heatmap(X_dcsbm, title="(D) $X = \\Theta C \\sqrt{B}$", ax=axs[3],
           xtitle="Latent Dimension", xticks=[0.5, 1.5], xticklabels=[1, 2],
           yticks=[0.5, 49.5, 99.5], yticklabels=[1, 50, 100], vmin=0, vmax=1)

fig.tight_layout()

fname = "dcsbm_lpm"
if mode != "png":
    fig.savefig(f"Figures/{mode:s}/{fname:s}.{mode:s}")

fig.savefig(f"Figures/png/{fname:s}.png")