3.5 Subnetworks and Connected Components#
mode = "svg"

import matplotlib

font = {'family' : 'Dejavu Sans',
        'weight' : 'normal',
        'size'   : 20}

matplotlib.rc('font', **font)

import matplotlib
from matplotlib import pyplot as plt
import networkx as nx
import numpy as np

# create an undirected network G
G = nx.Graph()
# add the nodes like before
G.add_node("SI", pos=(2,1))
G.add_node("MH", pos=(4,4))
G.add_node("BK", pos=(4,1.7))
G.add_node("Q", pos=(6,3))
G.add_node("BX", pos=(6,6))

# specify boroughs that are connected to one another
pos = nx.get_node_attributes(G, 'pos')
G.add_edge("SI", "BK")
G.add_edge("MH", "BK")
G.add_edge("BK", "Q")
G.add_edge("MH", "Q")
G.add_edge("MH", "BX")
G.add_edge("Q", "BX")

A = nx.to_numpy_array(G)
import os
fig, axs = plt.subplots(1, 3, figsize=(18, 5))
nx.draw_networkx(G, with_labels=True, node_color="white", pos=pos,
font_size=20, node_size=1500, font_color="black", arrows=False,
width=1, edgecolors="#000000", ax=axs[0])
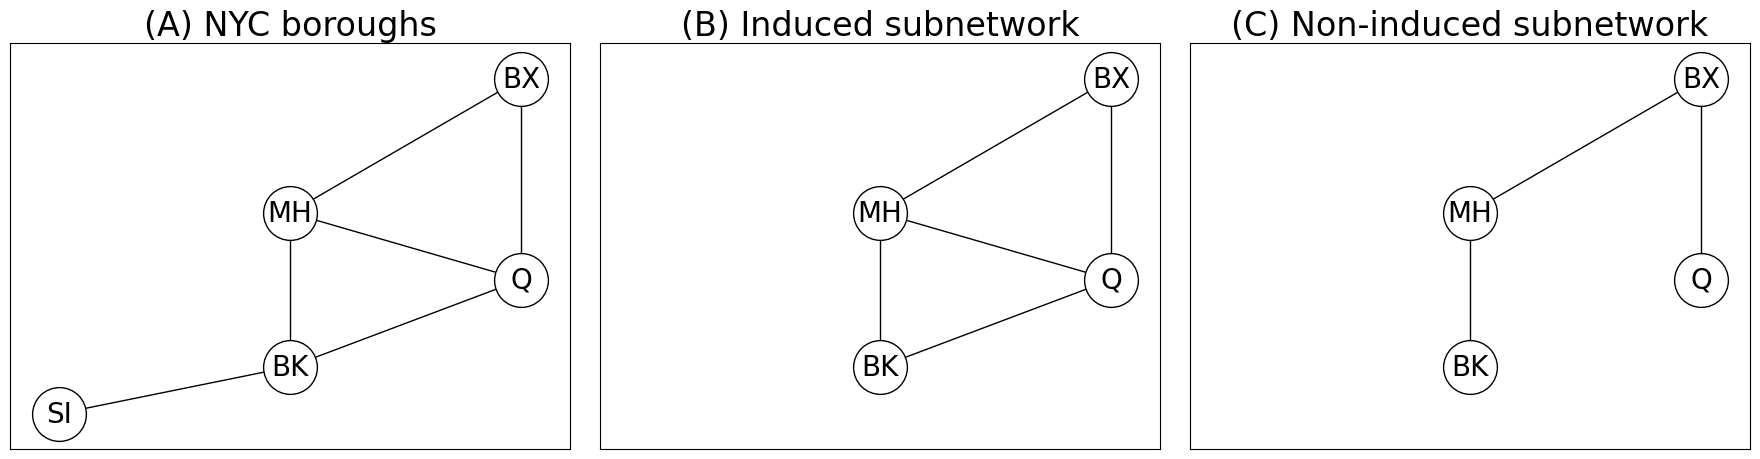
axs[0].set_title("(A) NYC boroughs")
G_induced = G.subgraph(["BK", "MH", "Q", "BX"]).copy()
nx.draw_networkx(G, node_color="white", font_color="white", width=0,
ax=axs[1], pos=pos)
nx.draw_networkx(G_induced, with_labels=True, node_color="white", pos=pos,
font_size=20, node_size=1500, font_color="black", arrows=False,
width=1, edgecolors="#000000", ax=axs[1])
axs[1].set_title("(B) Induced subnetwork")
G_nonind = nx.Graph()
# add the nodes like before
G_nonind.add_node("MH", pos=(4,4))
G_nonind.add_node("BK", pos=(4,1.7))
G_nonind.add_node("Q", pos=(6,3))
G_nonind.add_node("BX", pos=(6,6))
G_nonind.add_edge("BK", "MH")
G_nonind.add_edge("MH", "BX")
G_nonind.add_edge("Q", "BX")
nx.draw_networkx(G, node_color="white", font_color="white", width=0,
ax=axs[2], pos=pos)
nx.draw_networkx(G_nonind, with_labels=True, node_color="white", pos=pos,
font_size=20, node_size=1500, font_color="black", arrows=False,
width=1, edgecolors="#000000", ax=axs[2])
axs[2].set_title("(C) Non-induced subnetwork")
fig.tight_layout()
os.makedirs("Figures", exist_ok=True)
fname = "subnet"
if mode != "png":
os.makedirs(f"Figures/{mode:s}", exist_ok=True)
fig.savefig(f"Figures/{mode:s}/{fname:s}.{mode:s}")
os.makedirs("Figures/png", exist_ok=True)
fig.savefig(f"Figures/png/{fname:s}.png")
from copy import deepcopy
fig, axs = plt.subplots(1, 3, figsize=(18, 5))
G_withbos = deepcopy(G)
G_withbos.add_node("BO", pos=(8, 6))
G_withbos.add_node("CA", pos=(8, 8))
G_withbos.add_edge("BO", "CA")
# returns a list of connected components, ordered
# by decreasing size (#nodes)
cc_withbos = nx.connected_components(G_withbos)
# return the connected components, as networks
CC_nets = [G_withbos.subgraph(cc).copy() for cc in cc_withbos]
# plotting
# fetch positions with boston and cambridge added
pos = nx.get_node_attributes(G_withbos, 'pos')
# axs[0]
nx.draw_networkx(G_withbos, with_labels=True, node_color="white", pos=pos,
font_size=20, node_size=1500, font_color="black", arrows=False,
width=1, edgecolors="#000000", ax=axs[0])
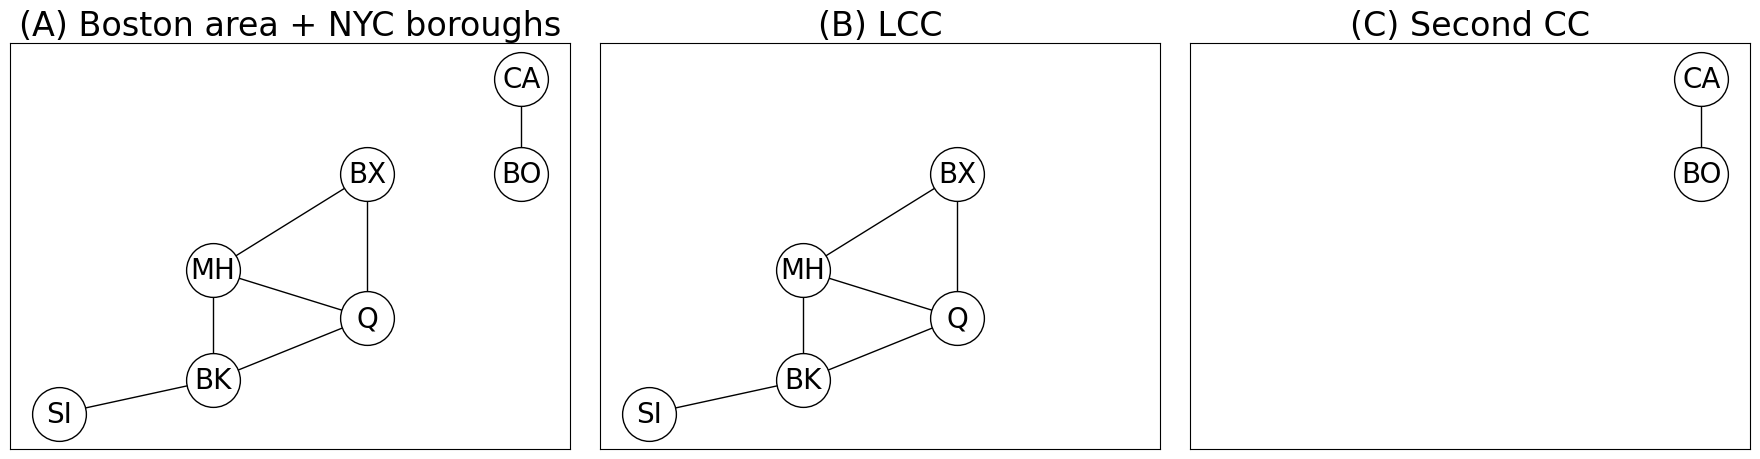
axs[0].set_title("(A) Boston area + NYC boroughs")
# axs[1]
nx.draw_networkx(G_withbos, node_color="white", font_color="white", width=0,
ax=axs[1], pos=pos)
nx.draw_networkx(CC_nets[0], with_labels=True, node_color="white", pos=pos,
font_size=20, node_size=1500, font_color="black", arrows=False,
width=1, edgecolors="#000000", ax=axs[1])
axs[1].set_title("(B) LCC")
nx.draw_networkx(G_withbos, node_color="white", font_color="white", width=0,
ax=axs[2], pos=pos)
nx.draw_networkx(CC_nets[1], with_labels=True, node_color="white", pos=pos,
font_size=20, node_size=1500, font_color="black", arrows=False,
width=1, edgecolors="#000000", ax=axs[2])
axs[2].set_title("(C) Second CC")
fig.tight_layout()
fname = "lcc"
if mode != "png":
fig.savefig(f"Figures/{mode:s}/{fname:s}.{mode:s}")
fig.savefig(f"Figures/png/{fname:s}.png")
from graspologic.utils import largest_connected_component as lcc

A_withbos = nx.to_numpy_array(G_withbos)
A_lcc, retained_nodes = lcc(A_withbos, return_inds=True)