6.4 Model selection with stochastic block models#
mode = "svg"

import matplotlib

font = {'family' : 'Dejavu Sans',
        'weight' : 'normal',
        'size'   : 20}

matplotlib.rc('font', **font)

import matplotlib
from matplotlib import pyplot as plt
import numpy as np
from graspologic.simulations import sbm
nk = 50 # 50 nodes per community
K = 2 # the number of communities
n = nk * K # total number of nodes
zs = np.repeat(np.arange(1, K+1), repeats=nk)
# block matrix
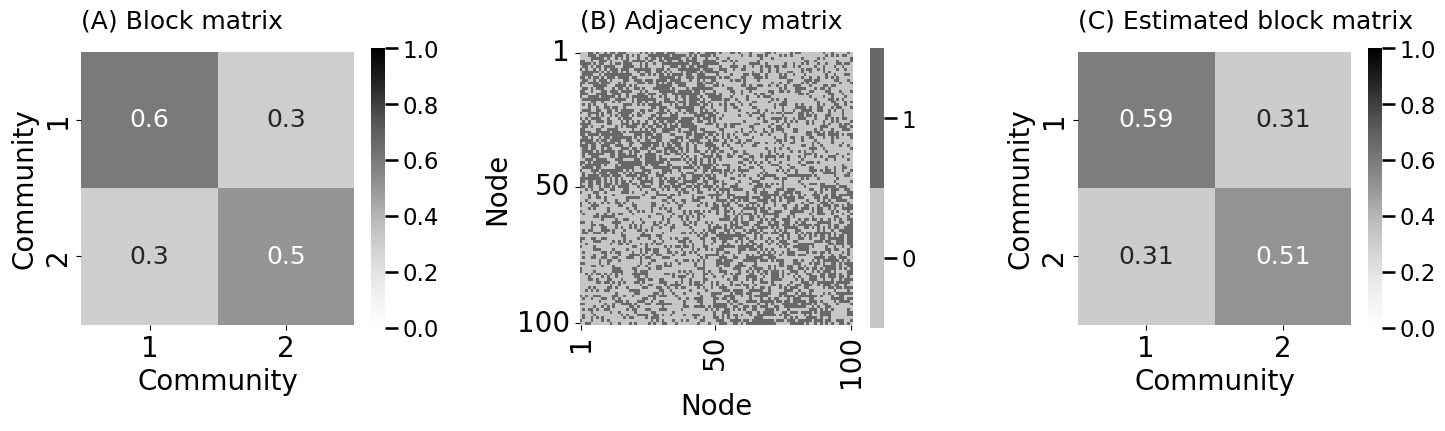
B = np.array([[0.6, 0.3],[0.3, 0.5]])
# generate network sample
np.random.seed(0)
A = sbm([nk, nk], B)
from graspologic.models import SBMEstimator

# instantiate the class object and fit
model = SBMEstimator(directed=False, loops=False)
model.fit(A, y=zs)
# obtain the estimate of the block matrix
Bhat = model.block_p_
from graphbook_code import heatmap
import os

fig, axs = plt.subplots(1, 3, figsize=(15, 5))

heatmap(B, ax=axs[0], xticks=[0.5, 1.5], xticklabels=[1, 2], yticks=[0.5, 1.5], yticklabels=[1, 2],
        xtitle="Community", ytitle="Community", title="(A) Block matrix",
        vmin=0, vmax=1, annot=True)

heatmap(A.astype(int), ax=axs[1], xticks=[0.5, 49.5, 99.5], xticklabels=[1, 50, 100],
        yticks=[0.5, 49.5, 99.5], yticklabels=[1, 50, 100],
        xtitle="Node", ytitle="Node", title="(B) Adjacency matrix")

heatmap(Bhat, ax=axs[2], xticks=[0.5, 1.5], xticklabels=[1, 2], yticks=[0.5, 1.5], yticklabels=[1, 2],
        xtitle="Community", ytitle="Community", title="(C) Estimated block matrix",
        vmin=0, vmax=1, annot=True)


fig.tight_layout()

os.makedirs("Figures", exist_ok=True)
fname = "model_select_ex"
if mode != "png":
    os.makedirs(f"Figures/{mode:s}", exist_ok=True)
    fig.savefig(f"Figures/{mode:s}/{fname:s}.{mode:s}")

os.makedirs("Figures/png", exist_ok=True)
fig.savefig(f"Figures/png/{fname:s}.png")
from graphbook_code import heatmap
# upper left has a value of 1, lower right has a value of 2,
# and upper right, bottom left have a value of 3
Z = np.array(zs).reshape(n, 1) @ np.array(zs).reshape(1, n)
# make lower right have a value of 3
Z[Z == 4] = 3
import statsmodels.api as sm
import pandas as pd
import statsmodels.formula.api as smf
from scipy import stats as spstat

# upper triangle since the network is simple (undirected and loopless)
upper_tri_non_diag = np.triu(np.ones(A.shape), k=1).astype(bool)

df_H1 = pd.DataFrame({"Value" : A[upper_tri_non_diag],
            "Group": (Z[upper_tri_non_diag] != 2).astype(int)})

# fit the logistic regression model
model_H1 = smf.logit("Value ~ C(Group)", df_H1).fit()

# compare the likelihood ratio statistic to the chi2 distribution
# with 1 dof to see the fraction that is less than l1
dof = 1
print(f"p-value: {spstat.chi2.sf(model_H1.llr, dof):.5f}")
# p-value: 0.00000
Optimization terminated successfully.
         Current function value: 0.651736
         Iterations 5
p-value: 0.00000
df_H2 = pd.DataFrame({"Value": A[upper_tri_non_diag],
                      "Group": Z[upper_tri_non_diag].astype(int)})
model_H2 = smf.logit("Value ~ C(Group)", df_H2).fit()
lr_stat_H2vsH1 = model_H2.llr - model_H1.llr
print(f"p-value: {spstat.chi2.sf(lr_stat_H2vsH1, 1):.5f}")
# p-value: 0.00008
Optimization terminated successfully.
         Current function value: 0.650168
         Iterations 5
p-value: 0.00008