3.3 Network summary statistics#
mode = "svg"

import matplotlib

font = {'family' : 'Dejavu Sans',
        'weight' : 'normal',
        'size'   : 20}

matplotlib.rc('font', **font)

import matplotlib
from matplotlib import pyplot as plt
import networkx as nx

# create an undirected network G
G = nx.Graph()
# add the nodes like before
G.add_node("SI", pos=(2,1))
G.add_node("MH", pos=(4,4))
G.add_node("BK", pos=(4,1.7))
G.add_node("Q", pos=(6,3))
G.add_node("BX", pos=(6,6))

# specify boroughs that are connected to one another
pos = nx.get_node_attributes(G, 'pos')
G.add_edge("SI", "BK")
G.add_edge("MH", "BK")
G.add_edge("BK", "Q")
G.add_edge("MH", "Q")
G.add_edge("MH", "BX")
G.add_edge("Q", "BX")

A = nx.to_numpy_array(G)
import os

fig, axs = plt.subplots(1, 2, figsize=(12, 5))
nx.draw_networkx(G, with_labels=True, node_color="white", pos=pos,
                 font_size=20, node_size=1500, font_color="black", arrows=False,
                 width=1, edgecolors="#000000", ax=axs[0])

G_pot = nx.Graph()
G_pot.add_node("SI", pos=(2,1))
G_pot.add_node("MH", pos=(4,4))
G_pot.add_node("BK", pos=(4,1.7))
G_pot.add_node("Q", pos=(6,3))
G_pot.add_node("BX", pos=(6,6))

for nodei in G_pot.nodes():
    for nodej in G_pot.nodes():
        if nodei != nodej:
            G_pot.add_edge(nodei, nodej)
nx.draw_networkx(G_pot, with_labels=True, node_color="white", pos=pos,
                 font_size=20, node_size=1500, font_color="black", arrows=False,
                 width=1, edgecolors="#000000", ax=axs[1])
axs[0].set_title("(A) NYC borough network")
axs[1].set_title("(B) Potential edges")
fig.tight_layout()

os.makedirs("Figures", exist_ok=True)
fname = "density"
if mode != "png":
    os.makedirs(f"Figures/{mode:s}", exist_ok=True)
    fig.savefig(f"Figures/{mode:s}/{fname:s}.{mode:s}")

os.makedirs("Figures/png", exist_ok=True)
fig.savefig(f"Figures/png/{fname:s}.png")
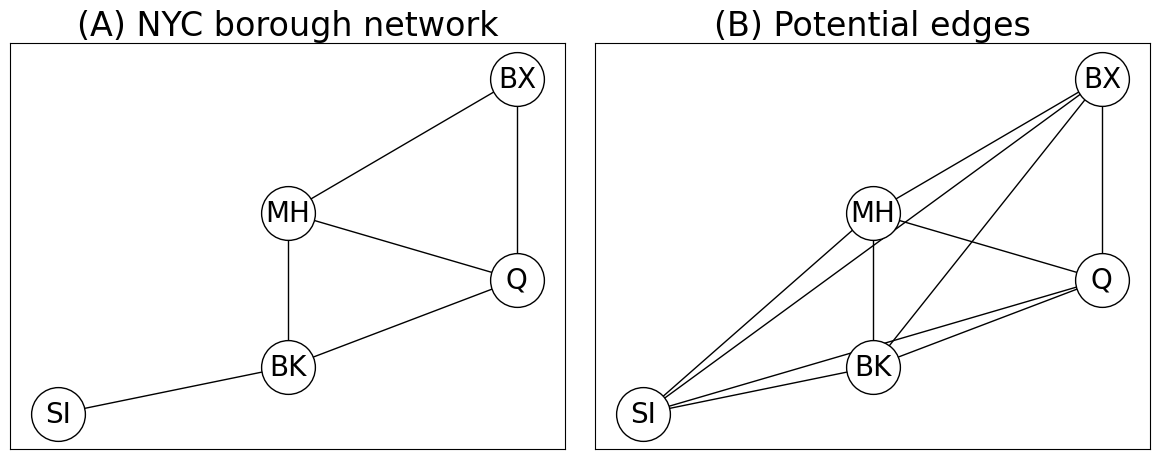
nx.density(G)
# 0.6
0.6
G_clus = nx.Graph()

G_clus.add_node("MH", pos=(4,4))
G_clus.add_node("BK", pos=(4,1.7))
G_clus.add_node("Q", pos=(6,3))
G_clus.add_node("BX", pos=(6,6))


pos = nx.get_node_attributes(G, 'pos')
G_clus.add_edge("MH", "BX")
G_clus.add_edge("MH", "BK")
G_clus.add_edge("BK", "Q")
G_clus.add_edge("MH", "Q")
G_clus.add_edge("Q", "BX")

nx.draw_networkx(G_clus, with_labels=True, node_color="white", pos=pos,
                 font_size=20, node_size=1500, font_color="black", arrows=False,
                 width=1, edgecolors="#000000")
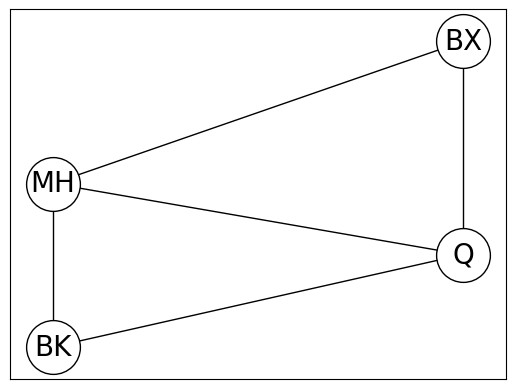
nx.transitivity(G_clus)
0.75
l = nx.average_shortest_path_length(G)