import numpy as np
import matplotlib.pyplot as plt
from mpl_toolkits.axisartist import SubplotZero
import matplotlib.patches as patch
import os
class myAxes():
def __init__(self, fig, rect, xlim=(-5,5), ylim=(-5,5)):
self.xlim = xlim
self.ylim = ylim
self.fig = fig
self.rect = rect
self.__scale_arrows()
def __drawArrow(self, x, y, dx, dy, width, length):
self.ax.arrow(
x, y, dx, dy,
color = 'k',
clip_on = False,
head_width = self.head_width,
head_length = self.head_length
)
def __scale_arrows(self):
""" Make the arrows look good regardless of the axis limits """
xrange = self.xlim[1] - self.xlim[0]
yrange = self.ylim[1] - self.ylim[0]
self.head_width = min(xrange/30, 0.25)
self.head_length = min(yrange/30, 0.3)
def __drawAxis(self):
"""
Draws the 2D cartesian axis
"""
self.ax = SubplotZero(self.fig, self.rect)
self.fig.add_subplot(self.ax)
# make xzero axis (horizontal axis line through y=0) visible.
for axis in ["xzero","yzero"]:
self.ax.axis[axis].set_visible(True)
# make the other axis (left, bottom, top, right) invisible
for n in ["left", "right", "bottom", "top"]:
self.ax.axis[n].set_visible(False)
# Plot limits
self.ax.set_xlim(self.xlim)
self.ax.set_ylim(self.ylim)
self.ax.set_yticks([-1, 1, ])
self.ax.set_xticks([-1, 0, 1])
# Draw the arrows
self.__drawArrow(self.xlim[1], 0, 0.01, 0, 0.3, 0.2) # x-axis arrow
self.__drawArrow(0, self.ylim[1], 0, 0.01, 0.2, 0.3) # y-axis arrow
def draw(self):
# First draw the axis
self.__drawAxis()
def set_title(self, title, pad=20):
"""
Sets the title for the subplot
"""
self.ax.set_title(title, pad=pad)
# Create the figure
fig = plt.figure(figsize=(15, 6))
# First subplot
axes1 = myAxes(fig, 131, xlim=(-2,2), ylim=(-2,2))
axes1.draw()
rectangle = patch.Rectangle((0,0), 3, 3, fc='black', ec="black", alpha=.2)
axes1.ax.add_patch(rectangle)
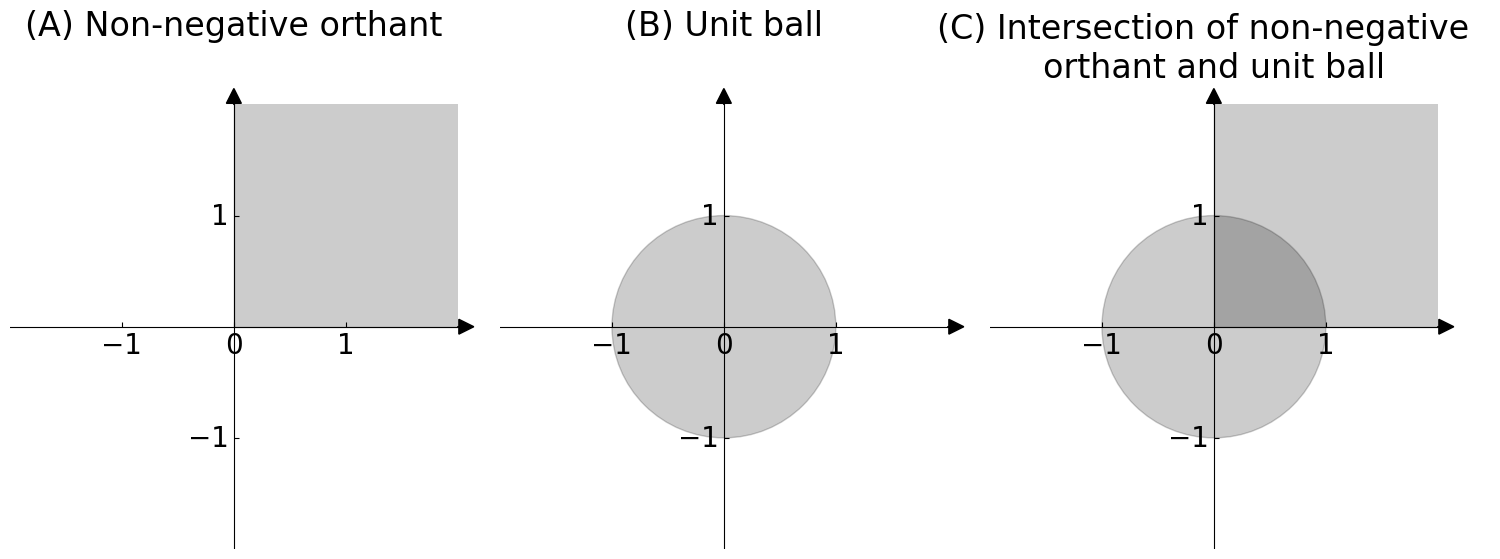
axes1.set_title("(A) Non-negative orthant", pad=50)
# Second subplot
axes2 = myAxes(fig, 132, xlim=(-2,2), ylim=(-2,2))
axes2.draw()
circle = patch.Circle((0,0), 1, fc='black', ec="black", alpha=.2)
axes2.ax.add_patch(circle)
axes2.set_title("(B) Unit ball", pad=50)
# Third subplot
axes3 = myAxes(fig, 133, xlim=(-2,2), ylim=(-2,2))
axes3.draw()
circle = patch.Circle((0,0), 1, fc='black', ec="black", alpha=.2)
axes3.ax.add_patch(circle)
rectangle = patch.Rectangle((0,0), 3, 3, fc='black', ec="black", alpha=.2)
axes3.ax.add_patch(rectangle)
axes3.set_title("(C) Intersection of non-negative \northant and unit ball")
fig.tight_layout()
os.makedirs("Figures", exist_ok=True)
fname = "rdpg_space"
if mode != "png":
os.makedirs(f"Figures/{mode:s}", exist_ok=True)
fig.savefig(f"Figures/{mode:s}/{fname:s}.{mode:s}")
os.makedirs("Figures/png", exist_ok=True)
fig.savefig(f"Figures/png/{fname:s}.png")