3.8 Edge-weight global rescaling#
mode = "svg"

import matplotlib

font = {'family' : 'Dejavu Sans',
        'weight' : 'normal',
        'size'   : 20}

matplotlib.rc('font', **font)

import matplotlib
from matplotlib import pyplot as plt
from graspologic.simulations import sbm
import numpy as np
from graphbook_code import heatmap
from graspologic.utils import symmetrize
from graspologic.utils import is_unweighted, is_loopless, is_symmetric

wtargsa = [[dict(n=50, p=.09), dict(n=50, p=.02)],
          [dict(n=50, p=.02), dict(n=50, p=.06)]]
# activity network as upper triangle matrix
A_activity_uppertri = sbm(n=[25, 25], p=[[1,1], [1,1]], wt=np.random.binomial, wtargs=wtargsa, loops=False, directed=False)
A_activity_uppertri = np.triu(A_activity_uppertri)
# upper-triangle symmetrize the upper triangle
A_activity = symmetrize(A_activity_uppertri, method="triu")

# friend network
wtargsf = [[dict(a=4, b=2), dict(a=2, b=6)],
          [dict(a=2, b=6), dict(a=6, b=2)]]
A_friend = sbm(n=[25, 25], p=[[.8, .4], [.4, 1]], wt=np.random.beta, wtargs=wtargsf, directed=True)
from scipy.stats import zscore

def z_score_loopless(X, undirected=False):
    if not is_loopless(X):
        raise TypeError("The network has loops!")
    if is_symmetric(X):
        raise TypeError("The network is undirected!")
    # the entries of the adjacency matrix that are not on the diagonal
    non_diag_idx = np.where(~np.eye(X.shape[0], dtype=bool))
    Z = np.zeros(X.shape)
    Z[non_diag_idx] = zscore(X[non_diag_idx])
    return Z

ZA_friend = z_score_loopless(A_friend)
from graspologic.utils import pass_to_ranks

RA_friend = pass_to_ranks(A_friend)
from seaborn import histplot
import os
fig, axs = plt.subplots(2,2, figsize=(15, 8), gridspec_kw={"height_ratios": [1, .5]})
def discard_diagonal(A):
"""
A function that discards the diagonal of a matrix,
and returns its non-diagonal edge-weights.
"""
# create a mask that is True for the non-diagonal edges
non_diag_idx = np.where(~np.eye(A.shape[0], dtype=bool))
return A[non_diag_idx].flatten()
# get the non-diagonal edge-weights
friend_nondiag_ew = discard_diagonal(A_friend)
# get the non-zero, non-diagonal edge weights
friend_nondiag_nz_ew = friend_nondiag_ew[friend_nondiag_ew > 0]
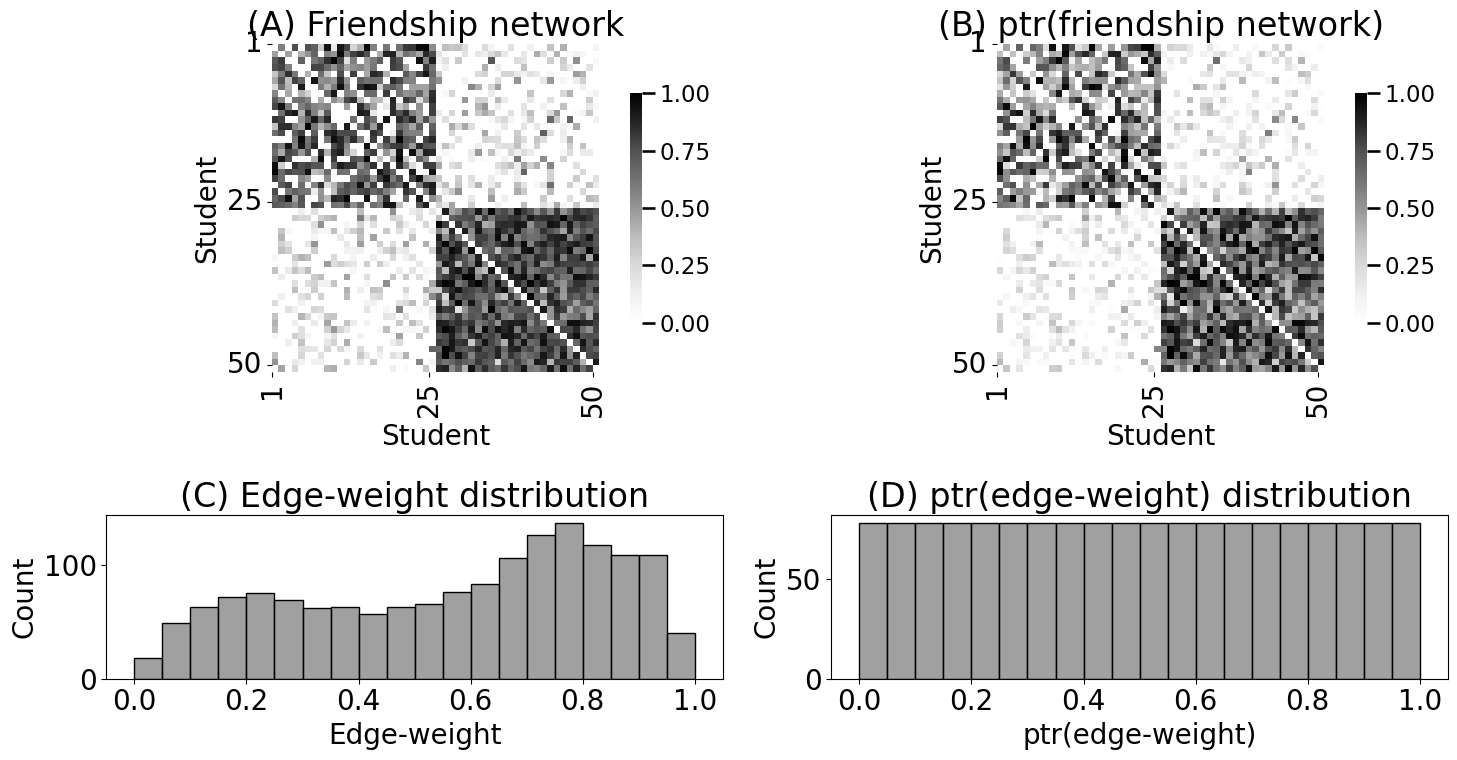
heatmap(A_friend, xticks=[0, 24, 49], yticks=[0, 24, 49],
xtitle="Student", ytitle="Student", xticklabels=[1,25,50],
yticklabels=[1,25,50], vmin=0, vmax=1, ax=axs[0][0])
axs[0][0].set_title("(A) Friendship network")
histplot(friend_nondiag_nz_ew, bins=20, binrange=(0, 1), ax=axs[1][0], color="gray")
axs[1][0].set_xlabel("Edge-weight")
axs[1][0].set_title("(C) Edge-weight distribution")
# get the non-diagonal edge-weights
friend_nondiag_ra = discard_diagonal(RA_friend)
# get the non-zero, non-diagonal edge weights
friend_nondiag_nz_ra = friend_nondiag_ra[friend_nondiag_ra > 0]
heatmap(RA_friend, xticks=[0, 24, 49], yticks=[0, 24, 49],
xtitle="Student", ytitle="Student", xticklabels=[1,25,50],
yticklabels=[1,25,50], vmin=0, vmax=1, ax=axs[0][1])
axs[0][1].set_title("(B) ptr(friendship network)")
histplot(friend_nondiag_nz_ra, bins=20, binrange=(0, 1), ax=axs[1][1], color="gray")
axs[1][1].set_xlabel("ptr(edge-weight)")
axs[1][1].set_title("(D) ptr(edge-weight) distribution")
fig.tight_layout()
os.makedirs("Figures", exist_ok=True)
fname = "ptr"
if mode != "png":
os.makedirs(f"Figures/{mode:s}", exist_ok=True)
fig.savefig(f"Figures/{mode:s}/{fname:s}.{mode:s}")
os.makedirs("Figures/png", exist_ok=True)
fig.savefig(f"Figures/png/{fname:s}.png")
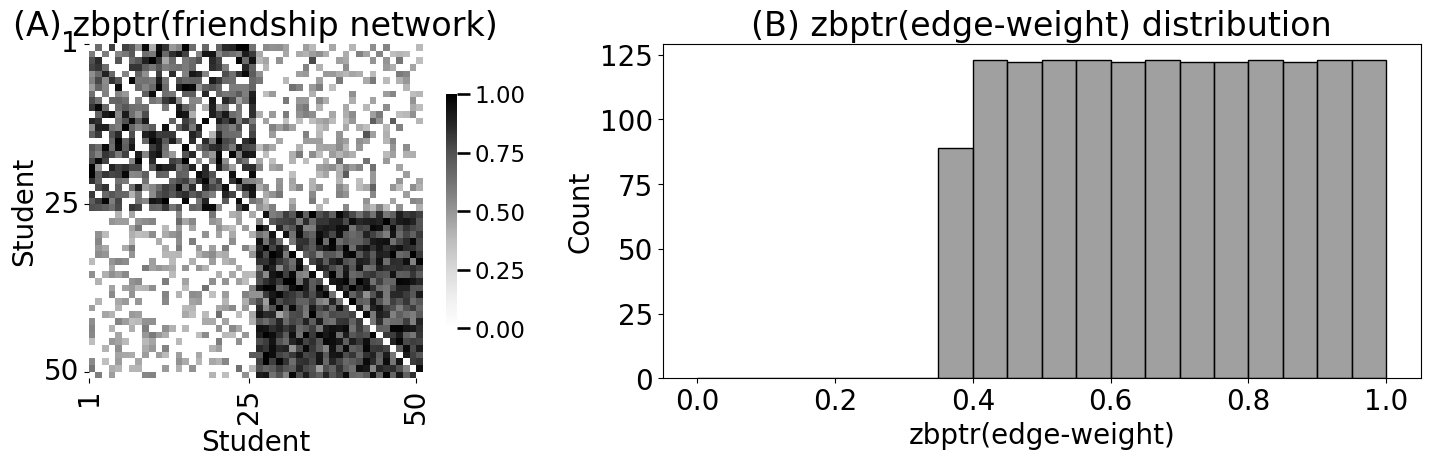
RA_friend_zb = pass_to_ranks(A_friend, method="zero-boost")

fig, axs = plt.subplots(1,2, figsize=(15,5), gridspec_kw={"width_ratios": [1.2, 2]})

# get the non-diagonal edge-weights
friend_nondiag_razb = discard_diagonal(RA_friend_zb)
# get the non-zero, non-diagonal edge weights
friend_nondiag_nz_razb = friend_nondiag_razb[friend_nondiag_razb > 0]

heatmap(RA_friend_zb, xticks=[0, 24, 49], yticks=[0, 24, 49],
        xtitle="Student", ytitle="Student", xticklabels=[1,25,50],
        yticklabels=[1,25,50], vmin=0, vmax=1, ax=axs[0])
axs[0].set_title("(A) zbptr(friendship network)")

histplot(friend_nondiag_nz_razb, bins=20, binrange=(0, 1), ax=axs[1], color="gray")
axs[1].set_xlabel("zbptr(edge-weight)")
axs[1].set_title("(B) zbptr(edge-weight) distribution")
fig.tight_layout()

fname = "ptr_zb"
if mode != "png":
    fig.savefig(f"Figures/{mode:s}/{fname:s}.{mode:s}")

fig.savefig(f"Figures/png/{fname:s}.png")
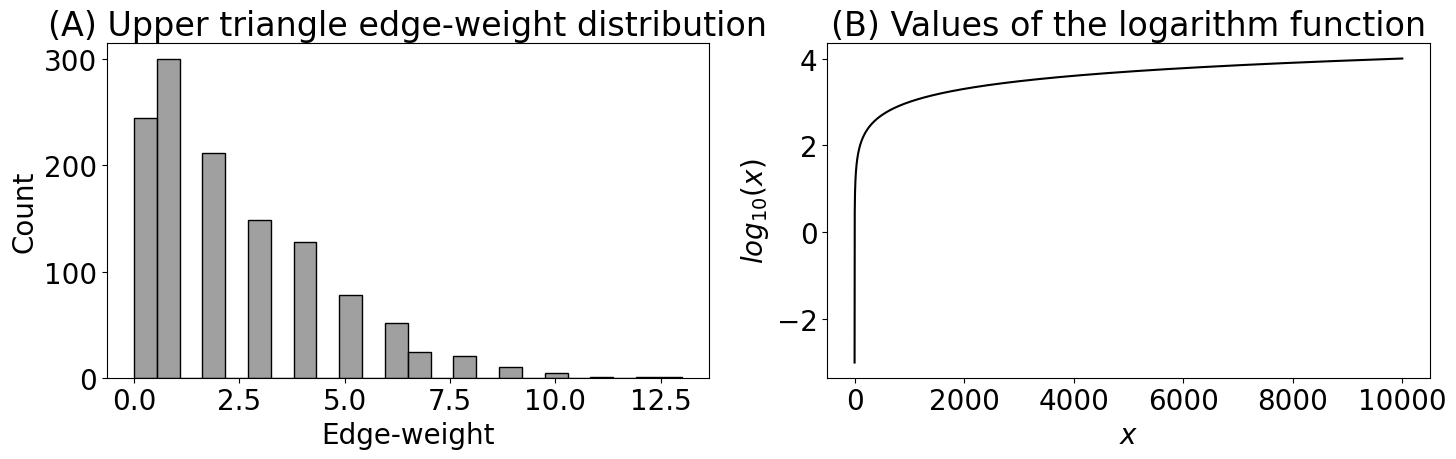
fig, axs = plt.subplots(1, 2, figsize=(15, 5))

# find the indices which are in the upper triangle and not in the diagonal
upper_tri_non_diag_idx = np.where(np.triu(np.ones(A_activity.shape), k=1).astype(bool))
histplot(A_activity[upper_tri_non_diag_idx].flatten(), color="gray", ax=axs[0])
axs[0].set_title("(A) Upper triangle edge-weight distribution")
axs[0].set_xlabel("Edge-weight")

x = np.linspace(.001, 10000, num=10000)
logx = np.log10(x)
axs[1].plot(x, logx, color="black")
axs[1].set_xlabel("$x$")
axs[1].set_ylabel("$log_{10}(x)$")
axs[1].set_title("(B) Values of the logarithm function")
fig.tight_layout()

fname = "log"
if mode != "png":
    fig.savefig(f"Figures/{mode:s}/{fname:s}.{mode:s}")

fig.savefig(f"Figures/png/{fname:s}.png")
def augment_zeros(X, base=10):
if np.any(X < 0):
raise TypeError("The logarithm is not defined for negative values!")
am = np.min(X[np.where(X > 0)]) # the smallest non-zero entry of X
eps = am/base # epsilon is one order of magnitude smaller than the smallest non-zero entry
return X + eps # augment all entries of X by epsilon
def log_transform(X, base=10):
"""
A function to log transform an adjacency matrix X, which may
have zero-weight edges.
"""
X_aug = augment_zeros(X, base=base)
return np.log(X_aug)/np.log(base)
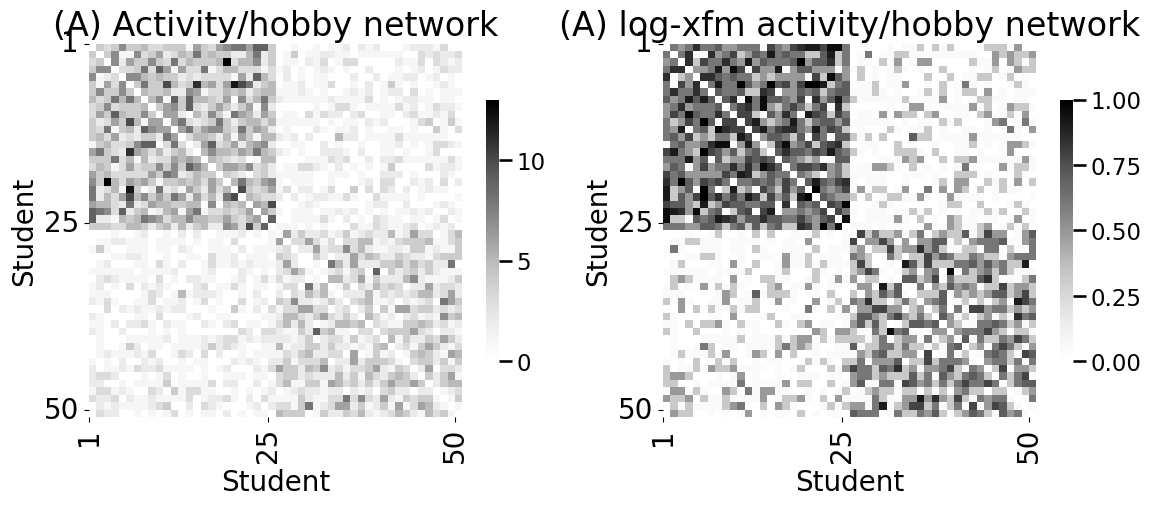
A_activity_log = log_transform(A_activity)
fig, axs = plt.subplots(1, 2, figsize=(12, 5))
heatmap(A_activity, xticks=[0, 24, 49], yticks=[0, 24, 49],
xtitle="Student", ytitle="Student", xticklabels=[1,25,50],
yticklabels=[1,25,50], ax=axs[0])
axs[0].set_title("(A) Activity/hobby network")
heatmap(A_activity_log, xticks=[0, 24, 49], yticks=[0, 24, 49],
xtitle="Student", ytitle="Student", xticklabels=[1,25,50],
yticklabels=[1,25,50], vmin=0, vmax=1, ax=axs[1])
axs[1].set_title("(A) log-xfm activity/hobby network")
fig.tight_layout()
fname = "log_xfm"
if mode != "png":
fig.savefig(f"Figures/{mode:s}/{fname:s}.{mode:s}")
fig.savefig(f"Figures/png/{fname:s}.png")