6.5 The vertex nomination problem#
mode = "svg"

import matplotlib

font = {'family' : 'Dejavu Sans',
        'weight' : 'normal',
        'size'   : 20}

matplotlib.rc('font', **font)

import matplotlib
from matplotlib import pyplot as plt
import numpy as np
from graspologic.simulations import sbm

# first 100 nodes are traffickers, second 900 are non-traffickers
ns = [100, 900]
B = np.array([[0.3, 0.1], [0.1, 0.2]])
np.random.seed(0)
A = sbm(ns, B)
# the number of seed nodes
nseeds = 20
# The first ns[0] nodes are the human traffickers, so choose 20 seeds
# at random
seed_ids = np.random.choice(ns[0], size=20, replace=False)
from graspologic.embed import AdjacencySpectralEmbed as ase

Xhat = ase(n_components=2, svd_seed=0).fit_transform(A)
from sklearn.cluster import KMeans

# community detection with kmeans
km_clust = KMeans(n_clusters=2, random_state=0)
km_clust.fit(Xhat)
labels_kmeans = km_clust.fit_predict(Xhat)
from graphbook_code import ohe_comm_vec

# estimated community assignment matrix
Chat = ohe_comm_vec(labels_kmeans)

# get the community (class) with the most seeds
comm_of_seeds = np.argmax(Chat[seed_ids,:].sum(axis=0))

# get centroid of the community that seeds tend to be
# assigned to
centroid_seeds = km_clust.cluster_centers_[comm_of_seeds]
from graspologic.embed import AdjacencySpectralEmbed as ase
from sklearn.cluster import KMeans
from graphbook_code import ohe_comm_vec

Xhat = ase().fit_transform(A)
# community detection with kmeans
km_clust = KMeans(n_clusters=2, random_state=0)
km_clust.fit(Xhat)
labels_kmeans = km_clust.fit_predict(Xhat)
from scipy.spatial.distance import cdist
from scipy.stats import rankdata

# compute the distance to the centroid for all estimated latent positions
dists_to_centroid = cdist(Xhat, centroid_seeds.reshape(1, -1)).reshape(-1)
# compute the node numbers for all the nonseed nodes
nonseed_bool = np.ones((np.sum(ns)))
nonseed_bool[seed_ids] = 0
nonseed_ids = np.array(np.where(nonseed_bool)).reshape(-1)

# isolate the distances to the centroid for the nonseed nodes
nonseed_dists = dists_to_centroid[nonseed_ids]
# produce the nomination list
nom_list_nonseeds = np.argsort(nonseed_dists).reshape(-1)
# obtain a nomination list in terms of the original node ids
nom_list = nonseed_ids[nom_list_nonseeds]
from graphbook_code import heatmap, plot_latents
import pandas as pd
import seaborn as sns
import os
fig, axs = plt.subplots(1, 3, figsize=(20, 6), gridspec_kw={"width_ratios": [2, 2, 2]})
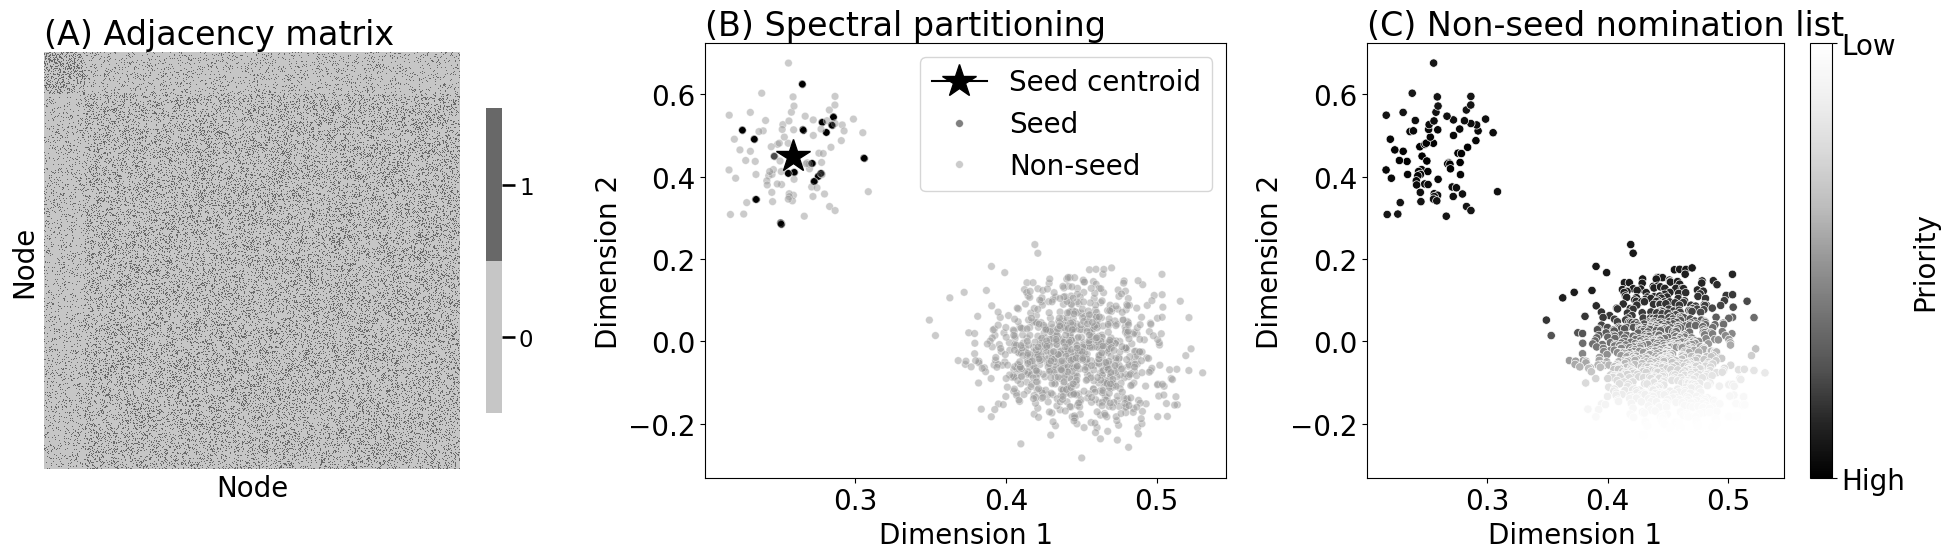
heatmap(A.astype(int), xtitle="Node", ytitle="Node",
title="(A) Adjacency matrix", ax=axs[0])
axs[0].set_title("(A) Adjacency matrix", loc="left")
seed_labels = ["Seed" if i in seed_ids else "Non-seed" for i in range(0, np.sum(ns))]
plot_latents(Xhat[seed_ids,:], title="(B) Spectral partitioning",
xtitle="Dimension 1", ytitle="Dimension 2",
s=30, alpha=1, legend=False,
ax=axs[1])
axs[1].plot(centroid_seeds[0], centroid_seeds[1], marker="*", markersize=25, color="black", label="Seed centroid")
plot_latents(Xhat, title="(B) Spectral partitioning",
xtitle="Dimension 1", ytitle="Dimension 2",
labels= seed_labels, s=30, alpha=0.5, legend=False,
ax=axs[1], palette={"Seed": "#000000", "Non-seed": "#999999"})
axs[1].legend()
nom_df = pd.DataFrame({"x":Xhat[nom_list,0], "y": Xhat[nom_list,1]})
nom_df["Priority"] = nom_df.reset_index().index
sns.scatterplot(data=nom_df, x="x", y="y", ax=axs[2], hue="Priority", palette="Greys_r", legend=False)
axs[2].set_title("(C) Non-seed nomination list", loc="left")
axs[2].set_xlabel("Dimension 1")
axs[2].set_ylabel("Dimension 2")
norm = plt.Normalize(vmin=nom_df["Priority"].min(), vmax=nom_df["Priority"].max())
sm = plt.cm.ScalarMappable(cmap="Greys_r", norm=norm)
sm.set_array([])
cbar = plt.colorbar(sm, ax=axs[2], ticks=[nom_df["Priority"].min(), nom_df["Priority"].max()])
cbar.set_label("Priority")
cbar.set_ticklabels(["High", "Low"])
fig.tight_layout()
os.makedirs("Figures", exist_ok=True)
fname = "vn"
if mode != "png":
os.makedirs(f"Figures/{mode:s}", exist_ok=True)
fig.savefig(f"Figures/{mode:s}/{fname:s}.{mode:s}")
os.makedirs("Figures/png", exist_ok=True)
fig.savefig(f"Figures/png/{fname:s}.png")
/opt/hostedtoolcache/Python/3.12.5/x64/lib/python3.12/site-packages/graphbook_code/plotting.py:502: UserWarning: Ignoring `palette` because no `hue` variable has been assigned.
  plot = sns.scatterplot(