from graphbook_code import heatmap, lpm_heatmap, plot_latents
import os
zin = np.delete(zs, oos_idx) + 1
fig, axs = plt.subplots(1, 3, figsize=(18, 6), gridspec_kw={"width_ratios": [2, 1, 2]})
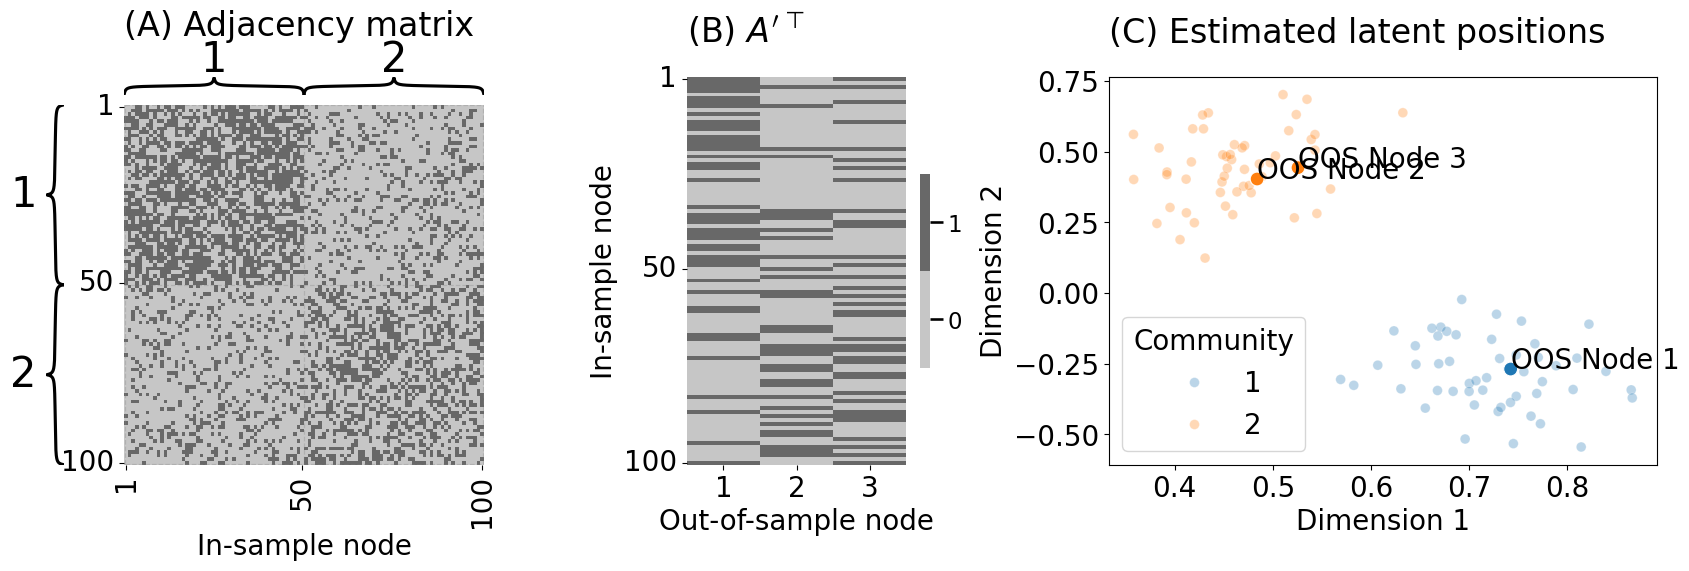
heatmap(Ain.astype(int), title="", xtitle="In-sample node", ax=axs[0],
inner_hier_labels=zin, xticks=[0.5, 49.5, 99.5], xticklabels=[1, 50, 100],
yticks=[0.5, 49.5, 99.5], yticklabels=[1, 50, 100], cbar=False)
axs[0].set_title("(A) Adjacency matrix", pad=50, loc="left")
lpm_heatmap(Aoos.T.astype(int), title="", xtitle="Out-of-sample node", ytitle="In-sample node",
xticks=[0.5, 1.5, 2.5], xticklabels=[1, 2, 3], yticks=[0.5, 49.5, 99.5],
yticklabels=[1, 50, 100], ax=axs[1])
axs[1].set_title("(B) $A'^\\top$", loc="left", pad=25)
plot_latents(Xhat_in, labels=zin, ax=axs[2], s=50, alpha=0.3, title="(C) Estimated latent positions",
xtitle="Dimension 1", ytitle="Dimension 2")
axs[2].set_title("(C) Estimated latent positions", loc="left", pad=25)
plot_latents(Xhat_oos, ax=axs[2], labels=zs[oos_idx] + 1, s=100)
handles, labels = axs[2].get_legend_handles_labels()
axs[2].legend(handles=handles[:2], labels=labels[:2], title="Community")
for i in range(Xhat_oos.shape[0]):
axs[2].annotate(f"OOS Node {i+1:d}", xy=(Xhat_oos[i,0], Xhat_oos[i,1]))
fig.tight_layout()
os.makedirs("Figures", exist_ok=True)
fname = "oos_ex"
if mode != "png":
os.makedirs(f"Figures/{mode:s}", exist_ok=True)
fig.savefig(f"Figures/{mode:s}/{fname:s}.{mode:s}")
os.makedirs("Figures/png", exist_ok=True)
fig.savefig(f"Figures/png/{fname:s}.png")