8.1 Anomaly detection in timeseries of networks#
mode = "svg"

import matplotlib

font = {'family' : 'Dejavu Sans',
        'weight' : 'normal',
        'size'   : 20}

matplotlib.rc('font', **font)

import matplotlib
from matplotlib import pyplot as plt
import numpy as np
from graspologic.simulations import sbm
from graphbook_code import dcsbm
np.random.seed(2)
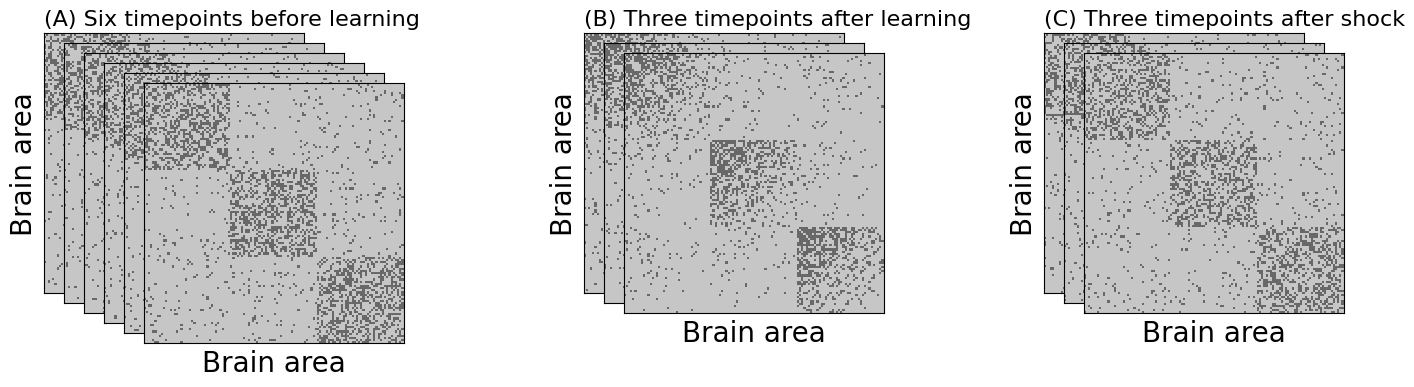
# the block matrix for the neurons before learning
B0 = 0.05*np.ones((3, 3))
np.fill_diagonal(B0, 0.4)
nk = 40
ns = np.repeat(nk, 3)
theta = np.tile(np.linspace(np.sqrt(2), np.sqrt(2) - 1, nk), 3)
zs = np.repeat([1,2,3], nk)
T = 12
networks = np.array([sbm(ns, B0) if (t < 6 or t >= 9) else dcsbm(zs, theta, B0) for t in range(T)])
from graphbook_code import heatmap
import seaborn as sns
import os

def add_border(ax, **kwargs):
    sns.despine(ax=ax, **kwargs)

# Create the combined figure
fig_combined = plt.figure(figsize=(20, 5))

for i in range(6):
    ax = fig_combined.add_axes([0.01 * i + 0.00, -0.02 * i, 0.13, 0.8])
    if i == 0:
        ylab = "Brain area"
    else:
        ylab = ""
    if i == 5:
        xlab = "Brain area"
    else:
        xlab = ""
    heatmap(networks[i].astype(int), ax=ax, xtitle=xlab, ytitle=ylab, cbar=False)
    if i == 0:
        ax.set_title("(A) Six timepoints before learning", loc="left", fontsize=16)
    add_border(ax, top=False, right=False)

# Add the axes from fig2
for i in range(3):
    ax = fig_combined.add_axes([0.01 * i + 0.27, -0.02 * i, 0.13, 0.8])
    if i == 0:
        ylab = "Brain area"
    else:
        ylab = ""
    if i == 2:
        xlab = "Brain area"
    else:
        xlab = ""
    heatmap(networks[i + 6].astype(int), ax=ax, xtitle=xlab, ytitle=ylab, cbar=False)
    if i == 0:
        ax.set_title("(B) Three timepoints after learning", loc="left", fontsize=16)
    add_border(ax, top=False, right=False)

# Add the axes from fig3
for i in range(3):
    ax = fig_combined.add_axes([0.01 * i + 0.5, -0.02 * i, 0.13, 0.8])
    if i == 0:
        ylab = "Brain area"
    else:
        ylab = ""
    if i == 2:
        xlab = "Brain area"
    else:
        xlab = ""
    heatmap(networks[i + 9].astype(int), ax=ax, xtitle=xlab, ytitle=ylab, cbar=False)
    if i == 0:
        ax.set_title("(C) Three timepoints after shock", loc="left", fontsize=16)
    add_border(ax, top=False, right=False)

fig_combined.tight_layout(rect=[0,0, 1, .95])

os.makedirs("Figures", exist_ok=True)
fname = "anom_ex"
if mode != "png":
    os.makedirs(f"Figures/{mode:s}", exist_ok=True)
    fig_combined.savefig(f"Figures/{mode:s}/{fname:s}.{mode:s}", bbox_inches='tight')

os.makedirs("Figures/png", exist_ok=True)
fig_combined.savefig(f"Figures/png/{fname:s}.png", bbox_inches='tight')
/tmp/ipykernel_2700/3431049457.py:58: UserWarning: This figure includes Axes that are not compatible with tight_layout, so results might be incorrect.
  fig_combined.tight_layout(rect=[0,0, 1, .95])
from graspologic.inference import latent_position_test
import warnings
warnings.filterwarnings('ignore')
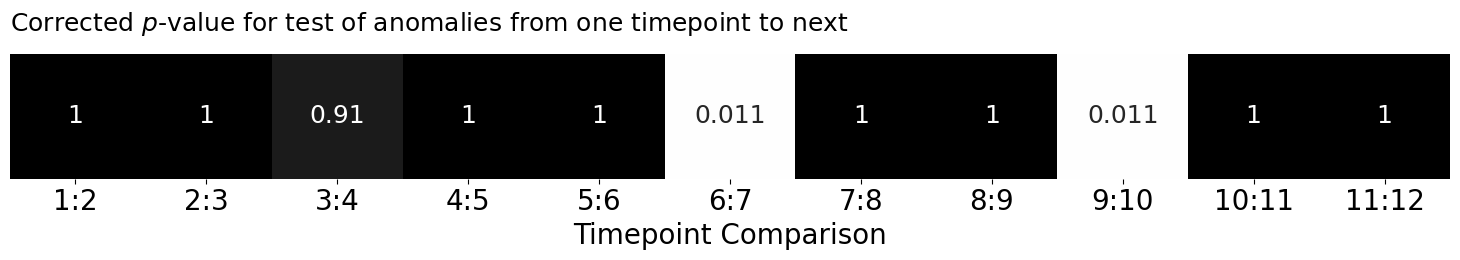
pvalues = [latent_position_test(networks[t + 1], networks[t], n_components=3,
n_bootstraps=1000, workers=-1)[1] for t in range(T-1)]
from statsmodels.stats.multitest import multipletests

alpha = 0.05
_, adj_pvals, _, _ = multipletests(pvalues, alpha=alpha, method="holm")
from graphbook_code import lpm_heatmap

fig, ax = plt.subplots(1, 1, figsize=(15, 3))

lpm_heatmap(adj_pvals.reshape(1, -1), title="Corrected $p$-value for test of anomalies from one timepoint to next",
            ax = ax, xtitle="Timepoint Comparison", annot=True, vmin=0, vmax=1, cbar=False,
           xticklabels=[f"{i+1:d}:{i+2:d}" for i in range(0, T-1)])

fig.tight_layout()

fname = "anom_pvals"
if mode != "png":
    fig.savefig(f"Figures/{mode:s}/{fname:s}.{mode:s}")

fig.savefig(f"Figures/png/{fname:s}.png")