4.4 Random Dot Product Graphs

4.4 Random Dot Product Graphs#

mode = "svg"

import matplotlib

font = {'family' : 'Dejavu Sans',
        'weight' : 'normal',
        'size'   : 20}

matplotlib.rc('font', **font)

import matplotlib
from matplotlib import pyplot as plt
import numpy as np
from graphbook_code import lpm_heatmap

n = 100  # the number of nodes in our network
# design the latent position matrix X according to 
# the rules we laid out previously
X = np.zeros((n,2))
for i in range(0, n):
    X[i,:] = [(n - i)/n, i/n]
from graspologic.simulations import rdpg
from graphbook_code import heatmap
# sample an RDPG with the latent position matrix
# created above
A = rdpg(X, loops=False, directed=False)

# and plot it
import os

fig, axs = plt.subplots(1, 2, figsize=(10, 5), gridspec_kw={"width_ratios": [1.5,3]})
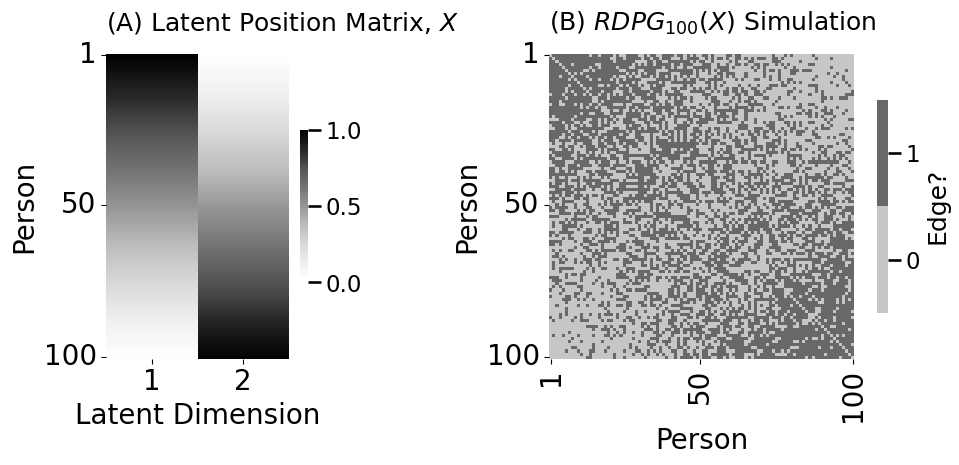
lpm_heatmap(X, ytitle="Person", xticks=[0.5, 1.5], xticklabels=[1, 2], yticks=[0.5, 49.5, 99.5],
            yticklabels=[1,50,100], xtitle="Latent Dimension", 
            title="(A) Latent Position Matrix, $X$", ax=axs[0])

heatmap(A.astype(int), xtitle="Person", ytitle="Person", 
        yticks=[0.5, 49.5, 99.5], yticklabels=[1,50,100],
        xticks=[0.5, 49.5, 99.5], xticklabels=[1,50,100],
        title="(B) $RDPG_{100}(X)$ Simulation", ax=axs[1], legend_title="Edge?")

fig.tight_layout()

os.makedirs("Figures", exist_ok=True)
fname = "rdpg"
if mode != "png":
    os.makedirs(f"Figures/{mode:s}", exist_ok=True)
    fig.savefig(f"Figures/{mode:s}/{fname:s}.{mode:s}")

os.makedirs("Figures/png", exist_ok=True)
fig.savefig(f"Figures/png/{fname:s}.png")
../../_images/36b0bede47313c024cbd9319656cc7d02202568980f239cdd344327feba65950.png