6.3 Testing for differences between groups of edges#
mode = "svg"

import matplotlib

font = {'family' : 'Dejavu Sans',
        'weight' : 'normal',
        'size'   : 20}

matplotlib.rc('font', **font)

import matplotlib
from matplotlib import pyplot as plt
import numpy as np
from graphbook_code import siem


n = 100
Z = np.ones((n, n))

# Fill the upper and lower 50th diagonals with 2
# and the main diagonal with 0
np.fill_diagonal(Z[:, 50:], 2)
np.fill_diagonal(Z[50:, :], 2)
np.fill_diagonal(Z, 0)

p = [0.4, 0.6]
np.random.seed(0)
A = siem(n, p, Z)
est_pvec = {k: A[Z == k].mean() for k in [1, 2]}
print(est_pvec)
# {1: 0.3955102040816327, 2: 0.6}
{1: 0.3955102040816327, 2: 0.6}
from scipy.stats import fisher_exact
import numpy as np

# assemble the contingency table indicated
table = np.array([[3, 7], [7, 3]])
_, pvalue = fisher_exact(table)
print(f"p-value: {pvalue:.3f}")
p-value: 0.179
# compute an upper-triangular mask to only look at the
# upper triangle since the network is simple (undirected and loopless)
upper_tri_mask = np.triu(np.ones(A.shape), k=1).astype(bool)
column_clust1 = [
    A[(Z == 1) & upper_tri_mask].sum(),
    (A[(Z == 1) & upper_tri_mask] == 0).sum(),
]
column_clust2 = [
    A[(Z == 2) & upper_tri_mask].sum(),
    (A[(Z == 2) & upper_tri_mask] == 0).sum(),
]
cont_tabl = np.vstack((column_clust1, column_clust2))
print(cont_tabl)
[[1938. 2962.]
 [  30.   20.]]
from graphbook_code import heatmap
import os
fig, axs = plt.subplots(1, 3, figsize=(20, 6))
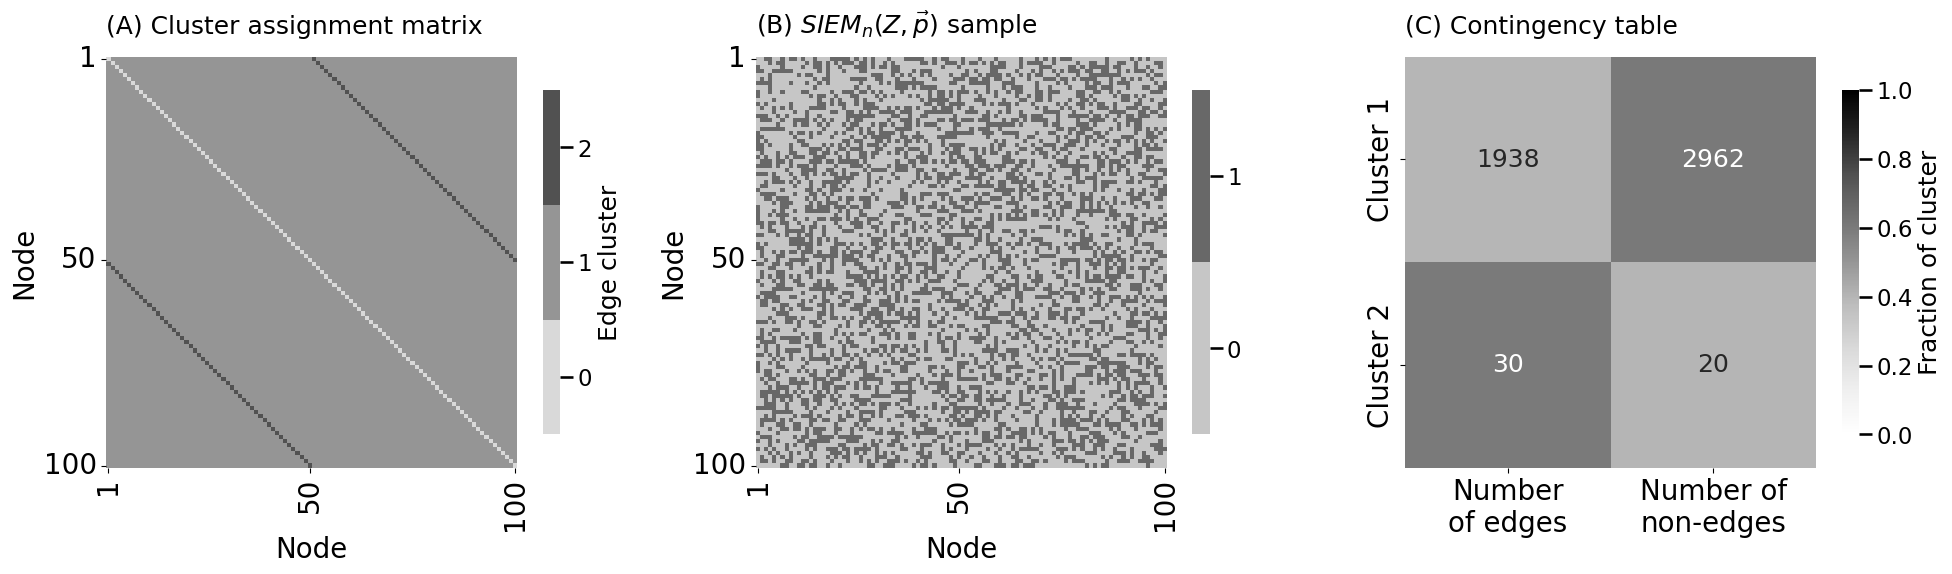
heatmap(Z.astype(int), ax=axs[0], xtitle="Node", ytitle="Node",
xticks=[0.5, 49.5, 99.5], xticklabels=[1, 50, 100],
yticks=[0.5, 49.5, 99.5], yticklabels=[1, 50, 100],
legend_title="Edge cluster", title="(A) Cluster assignment matrix")
heatmap(A.astype(int), ax=axs[1], xtitle="Node", ytitle="Node",
xticks=[0.5, 49.5, 99.5], xticklabels=[1, 50, 100],
yticks=[0.5, 49.5, 99.5], yticklabels=[1, 50, 100],
title="(B) $SIEM_n(Z, \\vec p)$ sample")
heatmap(cont_tabl/cont_tabl.sum(axis=1, keepdims=1), ax=axs[2], title="(C) Contingency table",
xticks=[0.5, 1.5], xticklabels=[f"Number\nof edges", f"Number of\nnon-edges"],
yticks=[0.5, 1.5], yticklabels=["Cluster 1", "Cluster 2"],
vmin=0, vmax=1, annot=cont_tabl.astype(int), legend_title="Fraction of cluster", fmt="d")
axs[2].tick_params(axis='y', labelrotation=90)
fig.tight_layout()
os.makedirs("Figures", exist_ok=True)
fname = "testing_siem_ex"
if mode != "png":
os.makedirs(f"Figures/{mode:s}", exist_ok=True)
fig.savefig(f"Figures/{mode:s}/{fname:s}.{mode:s}")
os.makedirs("Figures/png", exist_ok=True)
fig.savefig(f"Figures/png/{fname:s}.png")
_, pvalue = fisher_exact(cont_tabl)
print(f"p-value: {pvalue:.5f}")
# p-value: 0.00523
p-value: 0.00523