4.3 Stochastic Block Models#
mode = "svg"

import matplotlib

font = {'family' : 'Dejavu Sans',
        'weight' : 'normal',
        'size'   : 20}

matplotlib.rc('font', **font)

import matplotlib
from matplotlib import pyplot as plt
from graphbook_code import plot_vector
import numpy as np
import os
n = 100 # number of students
fig, axs = plt.subplots(1, 2, figsize=(10, 5), gridspec_kw={"width_ratios": [.3, 1]})
# z is a column vector of 50 1s followed by 50 2s
# this vector gives the school each of the 100 students are from
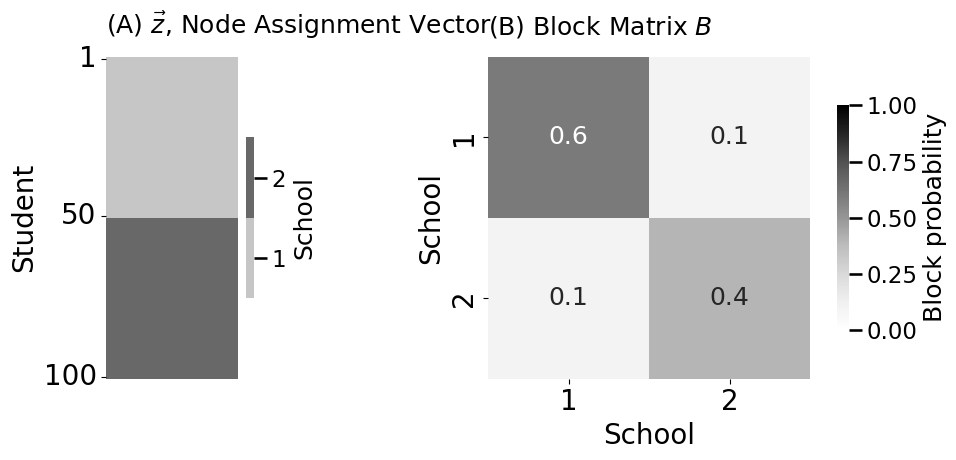
z = np.repeat([1, 2], repeats=n//2)
plot_vector(z.astype(int), title="(A) $\\vec z$, Node Assignment Vector",
legend_title="School",
ticks=[0.5, 49.5, 99.5], ticklabels=[1, 50, 100],
ticktitle="Student", ax=axs[0])
from graphbook_code import heatmap
K = 2 # community count
# construct the block matrix B as described above
B = np.array([[0.6, 0.1],
[0.1, 0.4]])
heatmap(B, xticklabels=[1, 2], yticklabels=[1,2], vmin=0,
vmax=1, annot=True, xtitle="School",
ytitle="School", title="(B) Block Matrix $B$", legend_title="Block probability", ax=axs[1])
fig.tight_layout()
os.makedirs("Figures", exist_ok=True)
fname = "sbm"
if mode != "png":
os.makedirs(f"Figures/{mode:s}", exist_ok=True)
fig.savefig(f"Figures/{mode:s}/{fname:s}.{mode:s}")
os.makedirs("Figures/png", exist_ok=True)
fig.savefig(f"Figures/png/{fname:s}.png")
from graspologic.simulations import sbm
from graphbook_code import draw_multiplot
# sample a graph from SBM_{100}(tau, B)
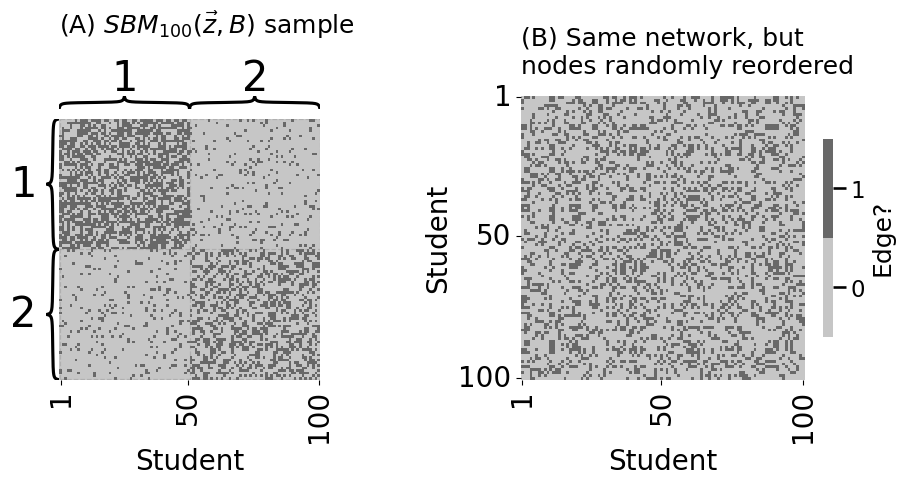
A, labels = sbm(n=[n//2, n//2], p=B, directed=False, loops=False, return_labels=True)
import numpy as np
import os

# generate a reordering of the n nodes
permutation = np.random.choice(n, size=n, replace=False)

Aperm = A[permutation][:,permutation]
yperm = labels[permutation]

fig, axs = plt.subplots(1,2,figsize=(10,5))
heatmap(A.astype(int), vmin=0, vmax=1, cbar=False,
        title="(A) $SBM_{100}(\\vec z, B)$ sample", xtitle="Student",
        xticks=[0.5, 49.5, 99.5], xticklabels=[1,50,100],
        inner_hier_labels=z,
        ax=axs[0])

heatmap(Aperm.astype(int), title="(B) Same network, but \nnodes randomly reordered", xtitle="Student",
        xticks=[0.5, 49.5, 99.5], xticklabels=[1,50,100], ytitle="Student",
        yticks=[0.5, 49.5, 99.5], yticklabels=[1,50,100], legend_title="Edge?",
        ax=axs[1])
fig.tight_layout()

fname = "sbm_adj"
if mode != "png":
    fig.savefig(f"Figures/{mode:s}/{fname:s}.{mode:s}")

fig.savefig(f"Figures/png/{fname:s}.png")
from graphbook_code import lpm_heatmap
def ohe_comm_vec(z):
"""
A function to generate the one-hot-encoded community
assignment matrix from a community assignment vector.
"""
K = len(np.unique(z))
n = len(z)
C = np.zeros((n, K))
for i, zi in enumerate(z):
C[i, zi - 1] = 1
return C
def generate_sbm_pmtx(z, B):
"""
A function to generate the probability matrix for an SBM.
"""
C = ohe_comm_vec(z)
return C @ B @ C.T
# the community assignment vector
z = np.repeat([1, 2], 50)
# block matrix
B = np.array([[0.6, 0.1],
[0.1, 0.4]])
# probability matrix
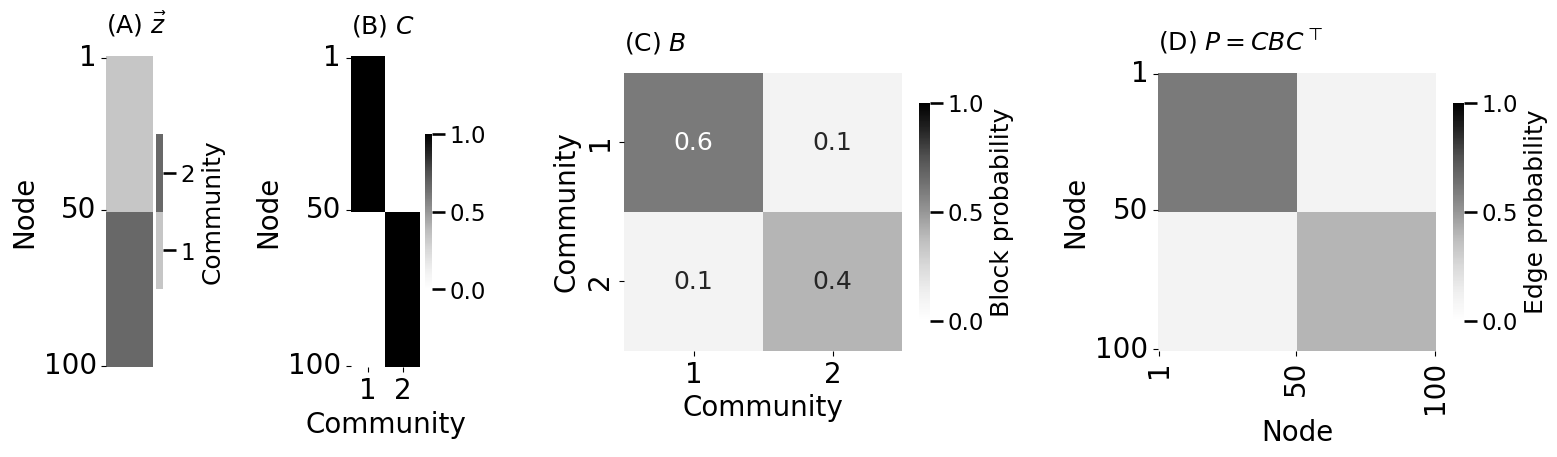
P = generate_sbm_pmtx(z, B)
fig, axs = plt.subplots(1, 4, figsize=(16, 5), gridspec_kw={"width_ratios": [2, 3, 12, 12]})
plot_vector(z.astype(int), title="(A) $\\vec z$",
legend_title="Community",
ticks=[0.5, 49.5, 99.5], ticklabels=[1, 50, 100],
ticktitle="Node", ax=axs[0])
lpm_heatmap(ohe_comm_vec(z), title="(B) $C$", xticks=[0.5, 1.5], xticklabels=[1,2], xtitle="Community",
yticks=[0.5, 49.5, 99.5], yticklabels=[1, 50, 100], ytitle="Node",
ax=axs[1])
heatmap(B, xticklabels=[1, 2], yticklabels=[1,2], vmin=0,
vmax=1, annot=True, xtitle="Community",
ytitle="Community", title="(C) $B$", legend_title="Block probability", ax=axs[2])
heatmap(P, title="(D) $P = CBC^\\top$", xtitle="Node",
xticks=[0.5, 49.5, 99.5], xticklabels=[1,50,100], ytitle="Node",
yticks=[0.5, 49.5, 99.5], yticklabels=[1,50,100], legend_title="Edge probability",
ax=axs[3], vmin=0, vmax=1)
fig.tight_layout()
fname = "sbm_prob"
if mode != "png":
fig.savefig(f"Figures/{mode:s}/{fname:s}.{mode:s}")
fig.savefig(f"Figures/png/{fname:s}.png")