Code Reproducibility#
from graspologic.simulations import sbm
from graspologic.embed import AdjacencySpectralEmbed as ASE
import numpy as np

ns = [50, 40, 30]
B = [[0.6, 0.2, 0.2],
     [0.2, 0.6, 0.2],
     [0.2, 0.2, 0.6]]

np.random.seed(1234)
A = sbm(n=ns, p = B)

# the true community labels
z = [0 for i in range(0,ns[0])] + [1 for i in range(0, ns[1])] + [2 for i in range(0, ns[2])]
Xhat = ASE(n_components=3).fit(A).latent_left_
from pandas import DataFrame
import seaborn as sns
import matplotlib.pyplot as plt
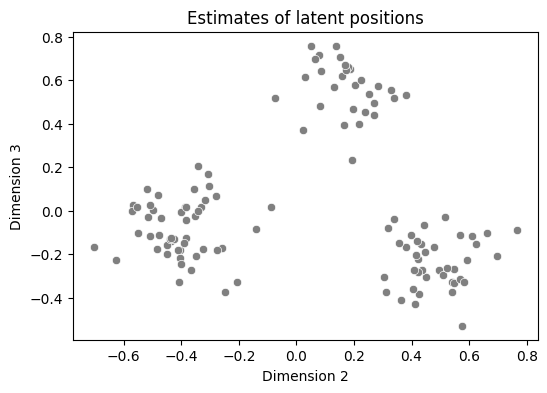
data = DataFrame({"Dimension 2" : Xhat[:,1], "Dimension 3" : Xhat[:,2]})
palette = {"0" : "blue", "1": "green", "2": "red"}
fig, ax = plt.subplots(1, 1, figsize=(6, 4))
sns.scatterplot(data=data, x="Dimension 2", y="Dimension 3", color="gray", ax=ax)
ax.set_title("Estimates of latent positions");
centers = np.array([[.5, .5], [-0.05, 0.05], [-0.05, -0.05]])
datcenters = DataFrame({"Dimension 2": centers[:,0], "Dimension 3": centers[:,1], "Cluster": ["0", "1","2"]})
from scipy.spatial import distance_matrix
distances = distance_matrix(Xhat[:,1:3], centers)
assignment = np.argmin(distances, axis=1)

data["Closest Center"] = assignment.astype(str)
centers = np.array([np.mean(Xhat[assignment == k,1:3], axis=0) for k in range(0, 3)])

datcenters = DataFrame({"Dimension 2": centers[:,0], "Dimension 3": centers[:,1], "Cluster": ["0", "1","2"]})
distances = distance_matrix(Xhat[:,1:3], centers)
assignment = np.argmin(distances, axis=1)
centers_new = np.array([np.mean(Xhat[assignment == k,1:3], axis=0) for k in range(0, 3)])

data["Closest Center"] = assignment.astype(str)
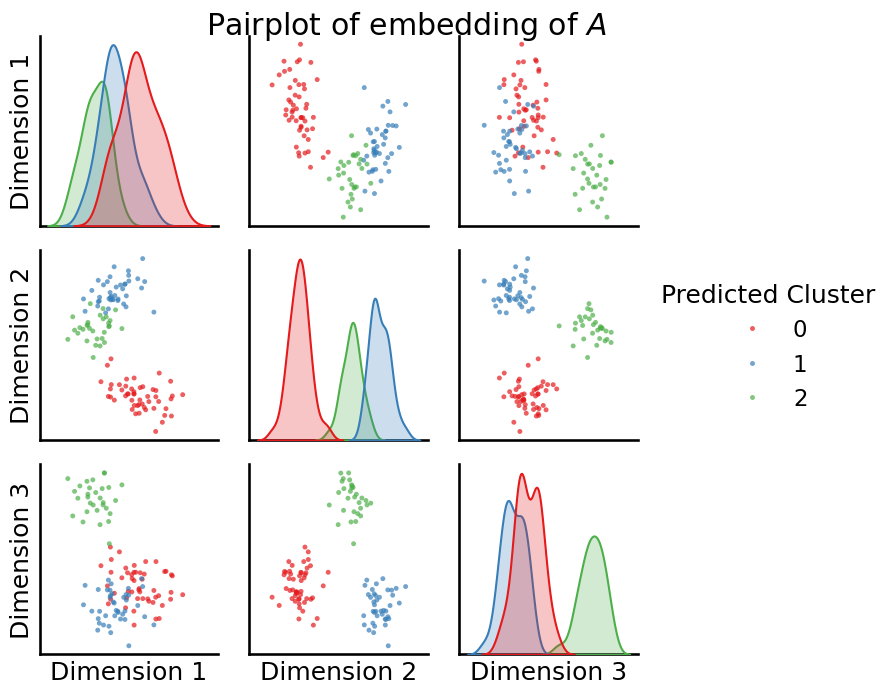
from sklearn.cluster import KMeans

labels_kmeans = KMeans(n_clusters = 3, random_state=1234).fit_predict(Xhat)
from graspologic.plot import pairplot

_ = pairplot(Xhat, labels=labels_kmeans, title="Pairplot of embedding of $A$", legend_name="Predicted Cluster")
from sklearn.metrics import confusion_matrix
# compute the confusion matrix between the true labels z
# and the predicted labels labels_kmeans
cf_matrix = confusion_matrix(z, labels_kmeans)
cfm_norm = cf_matrix/cf_matrix.sum(axis=1)[:,None]
from graphbook_code import cmaps

fig, ax = plt.subplots(1,1, figsize=(6,4))
sns.heatmap(cfm_norm, cmap=cmaps["sequential"], ax=ax)
ax.set_title("Normalized confusion matrix")
ax.set_ylabel("True Label")
ax.set_xlabel("Predicted Label");
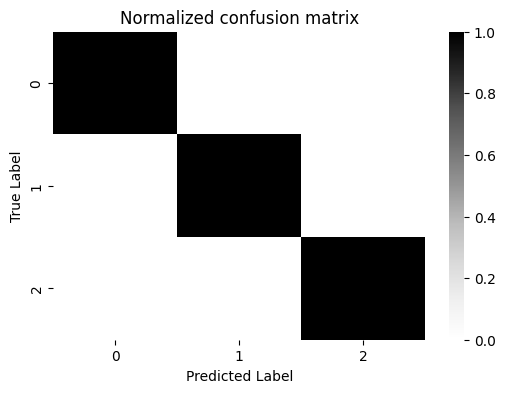
from sklearn.metrics import adjusted_rand_score

ari_kmeans = adjusted_rand_score(z, labels_kmeans)
print("ARI(predicted communities, true communities) = {}".format(ari_kmeans))
ARI(predicted communities, true communities) = 1.0